swipos statistics 2021 |
||
|---|---|---|
| Back to PNAC monitoring | ||
Content |
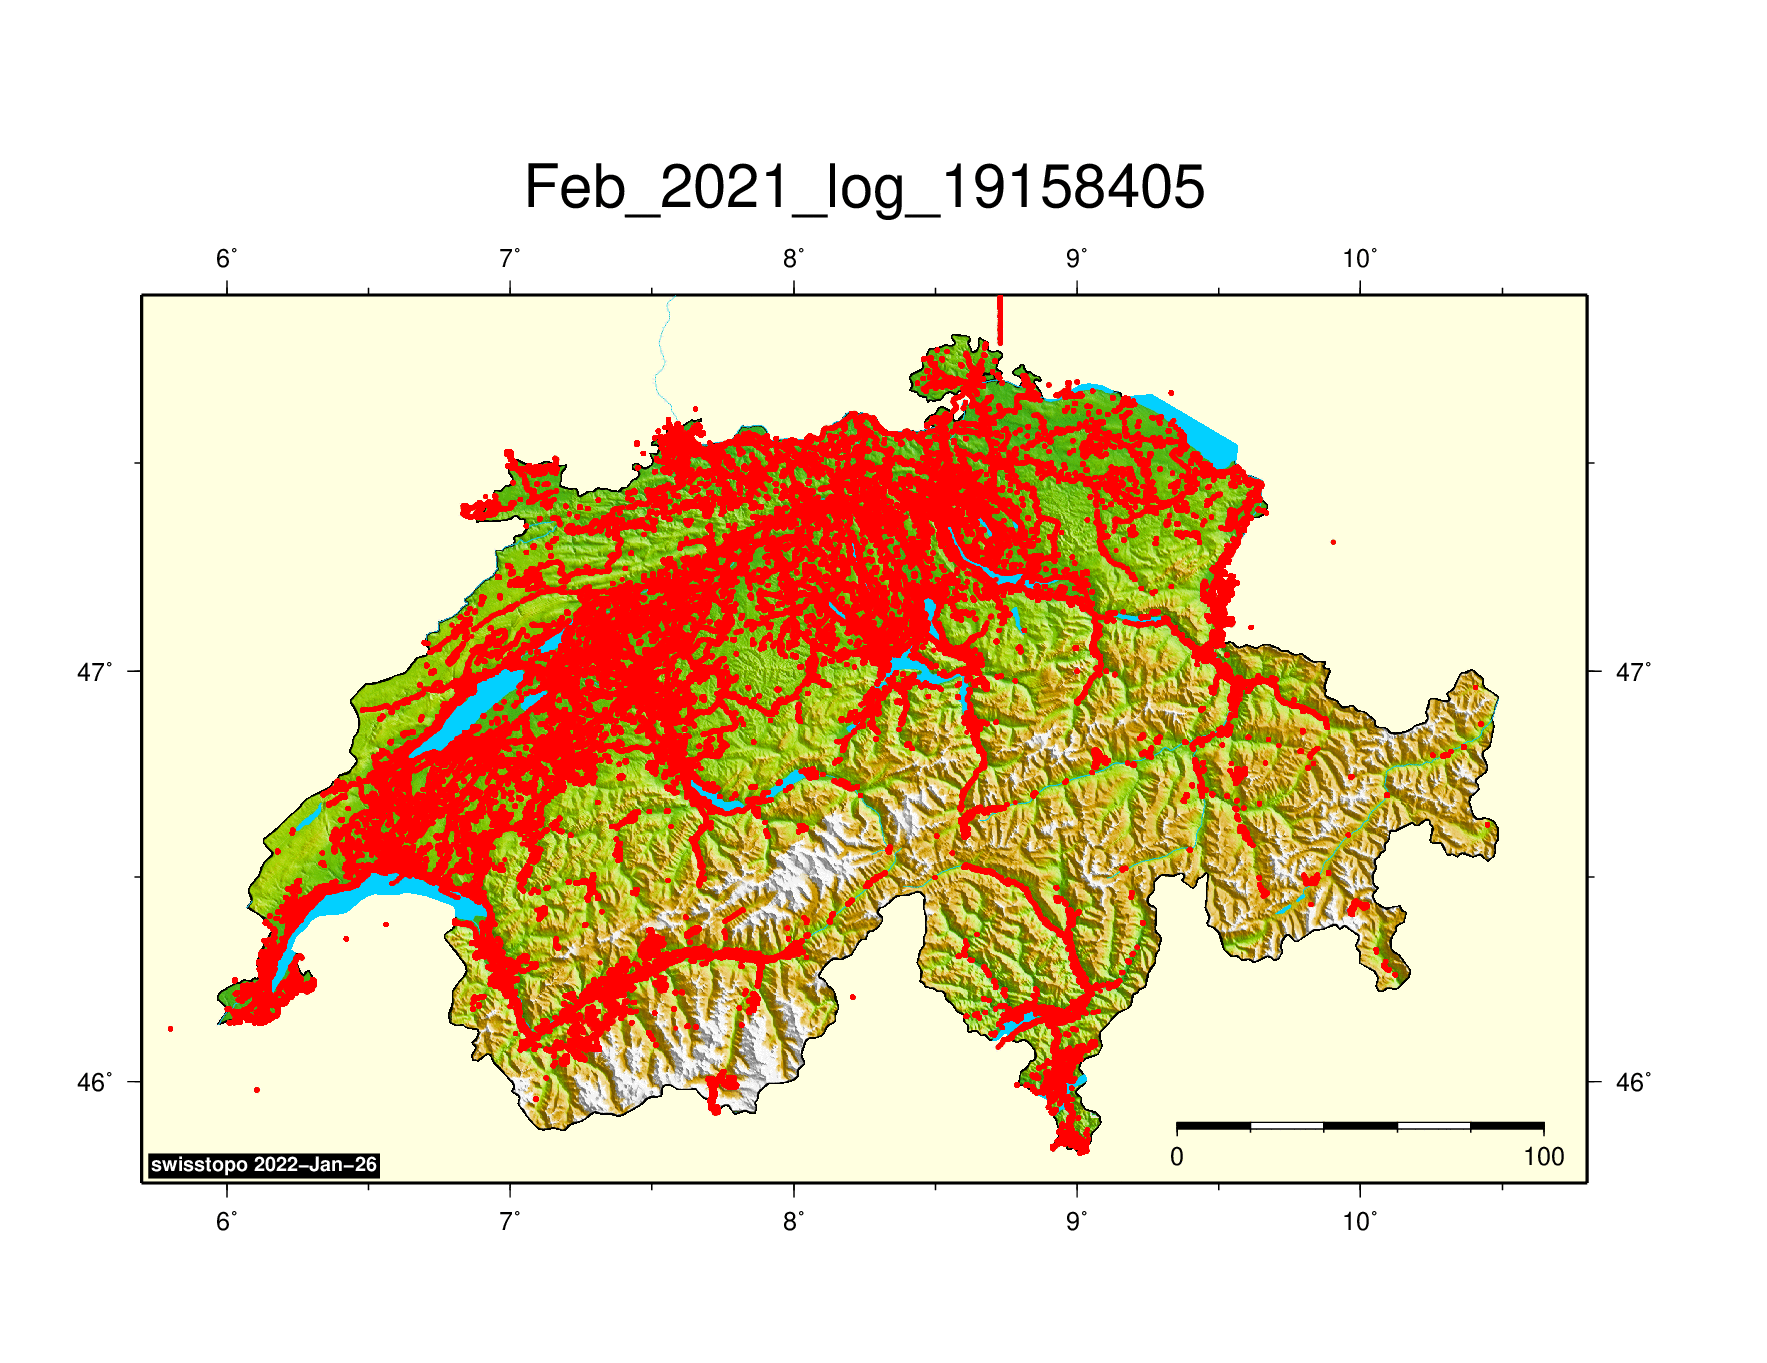
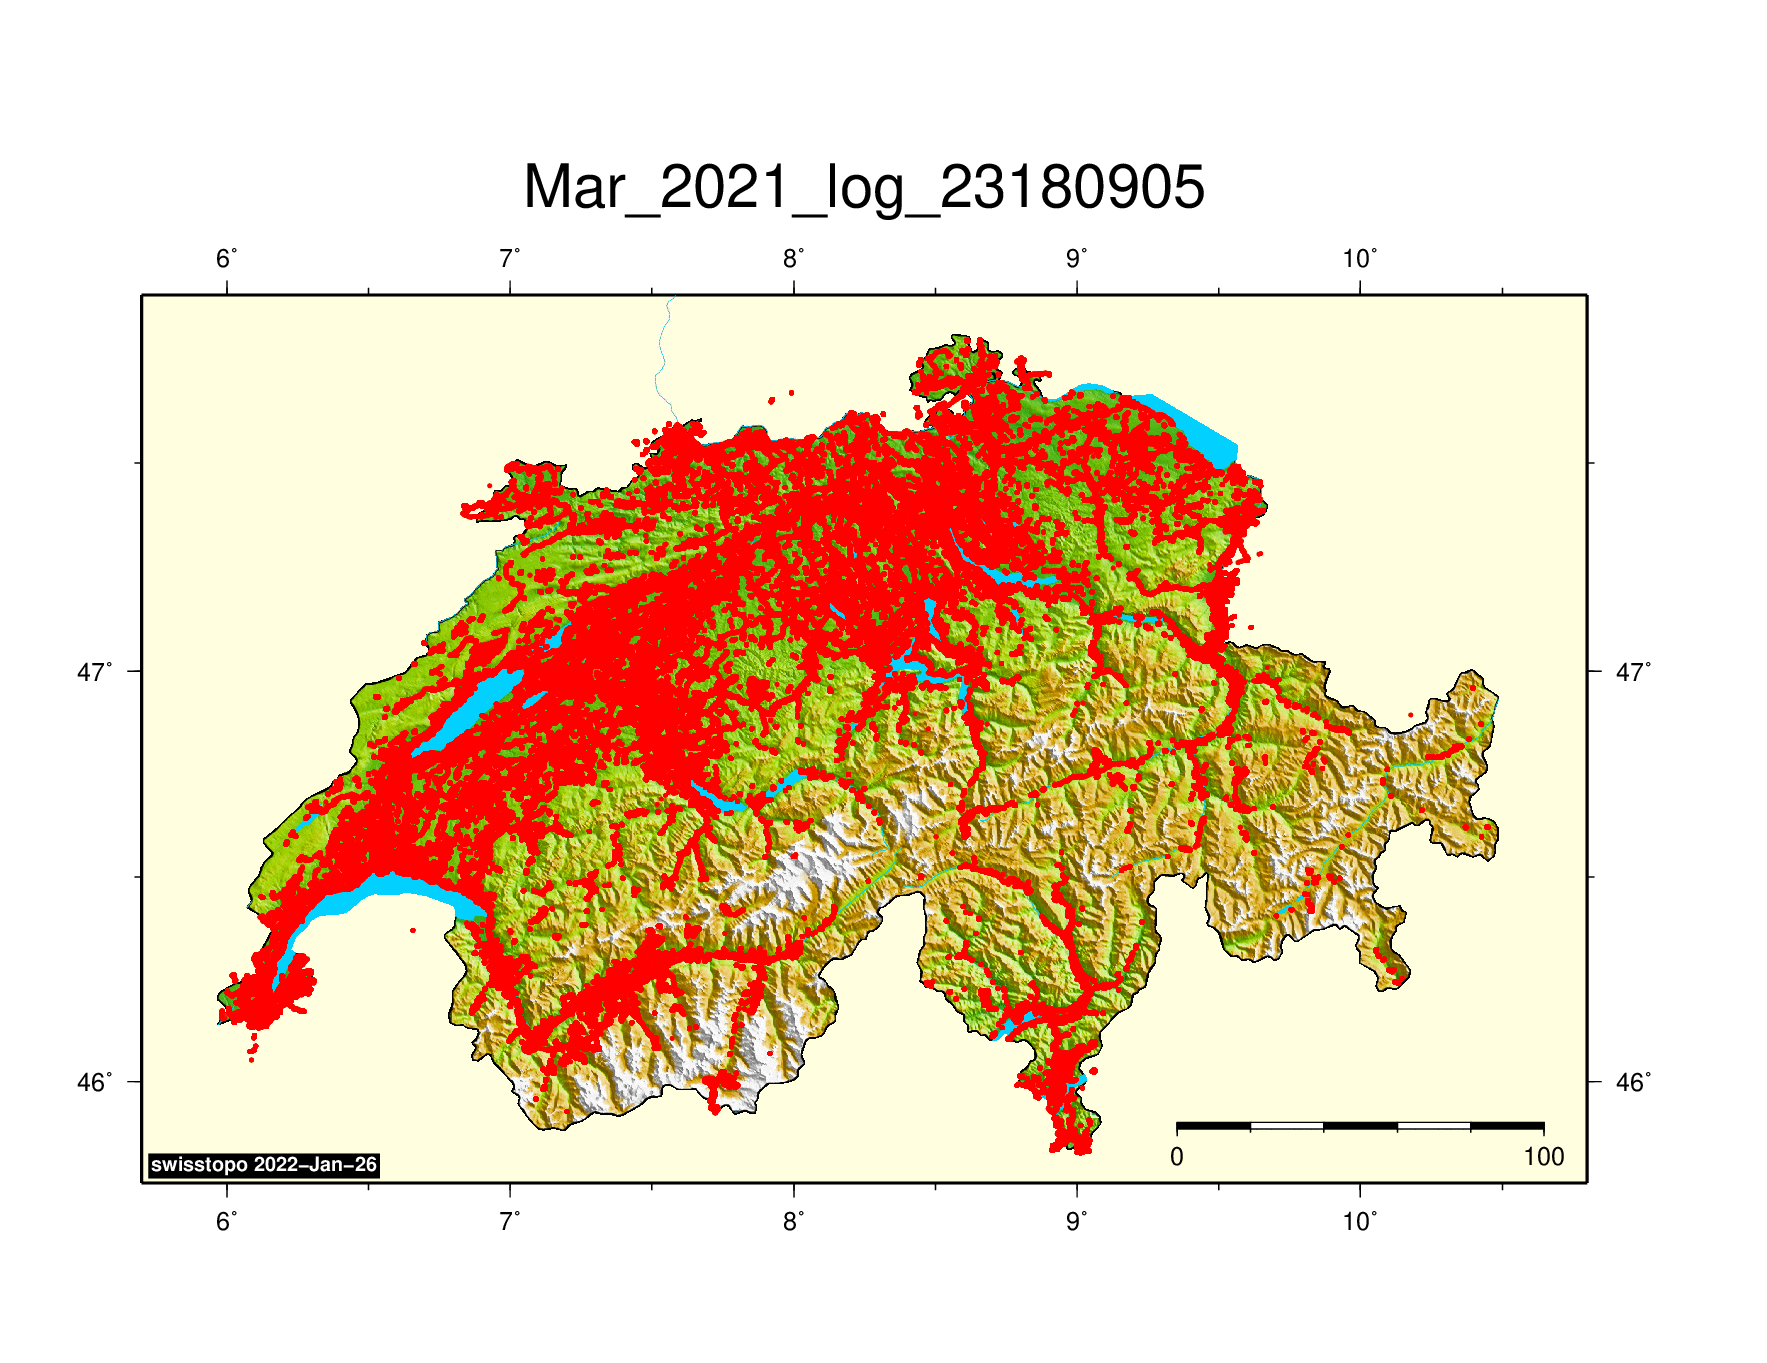
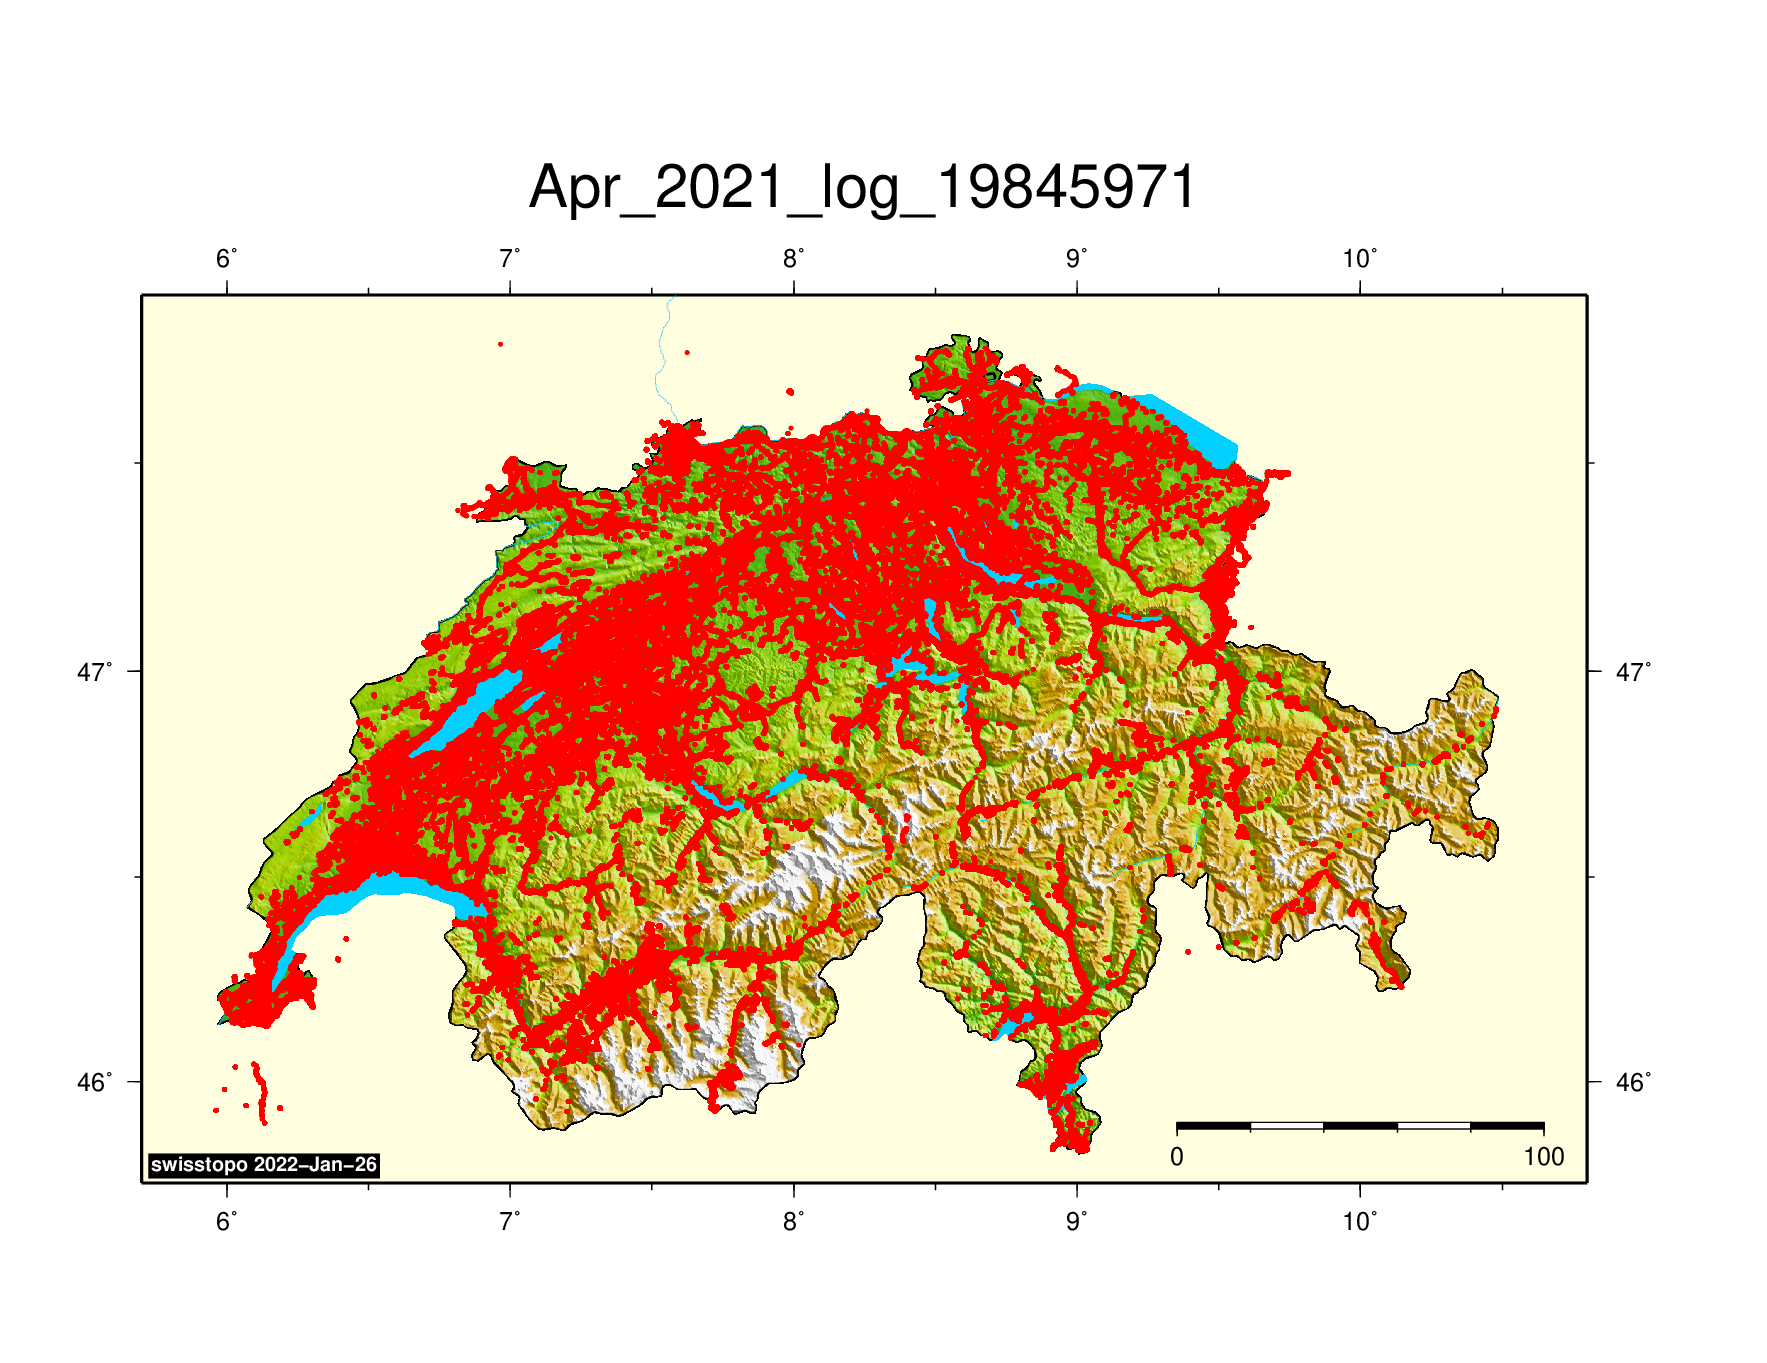
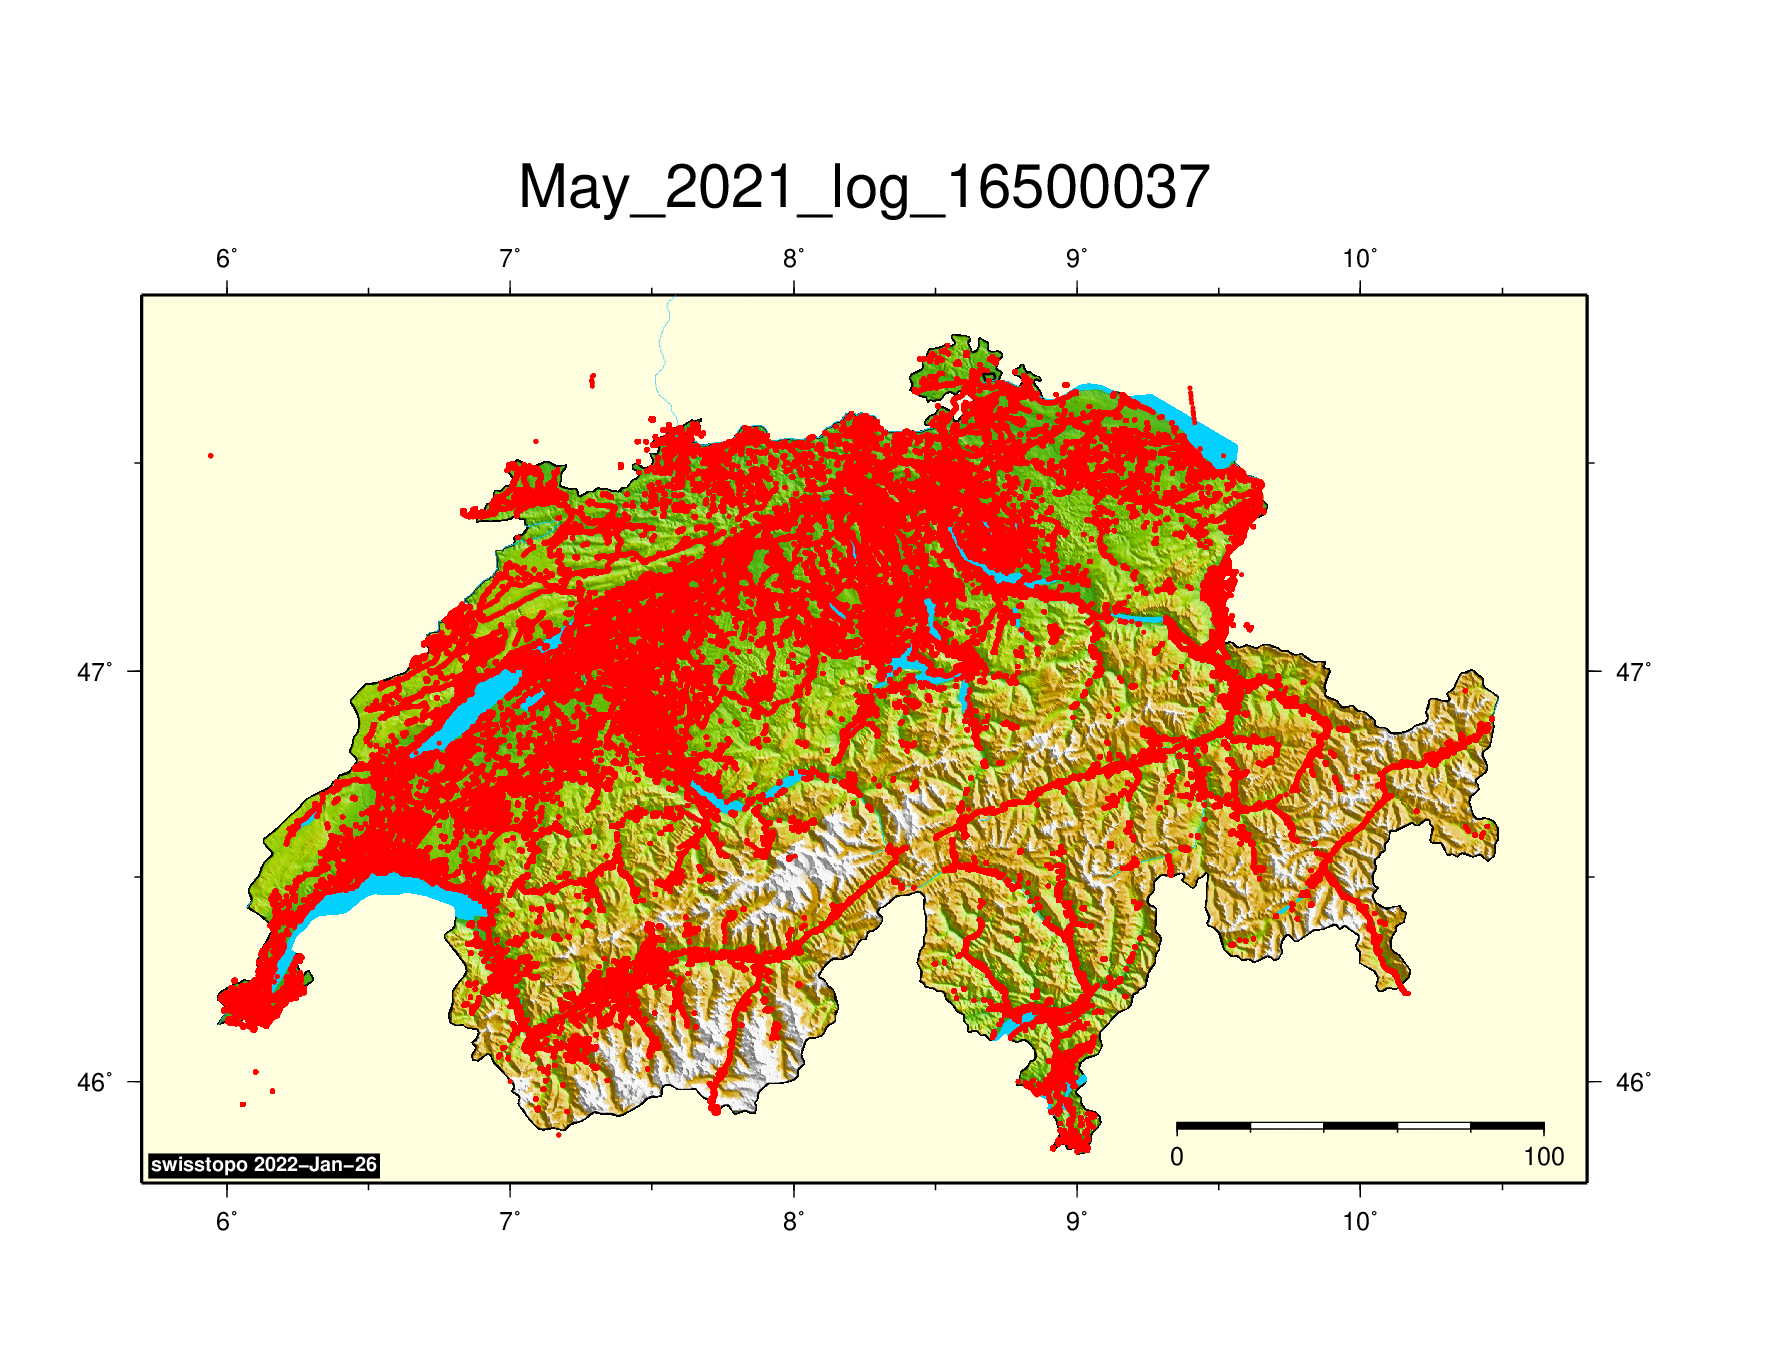
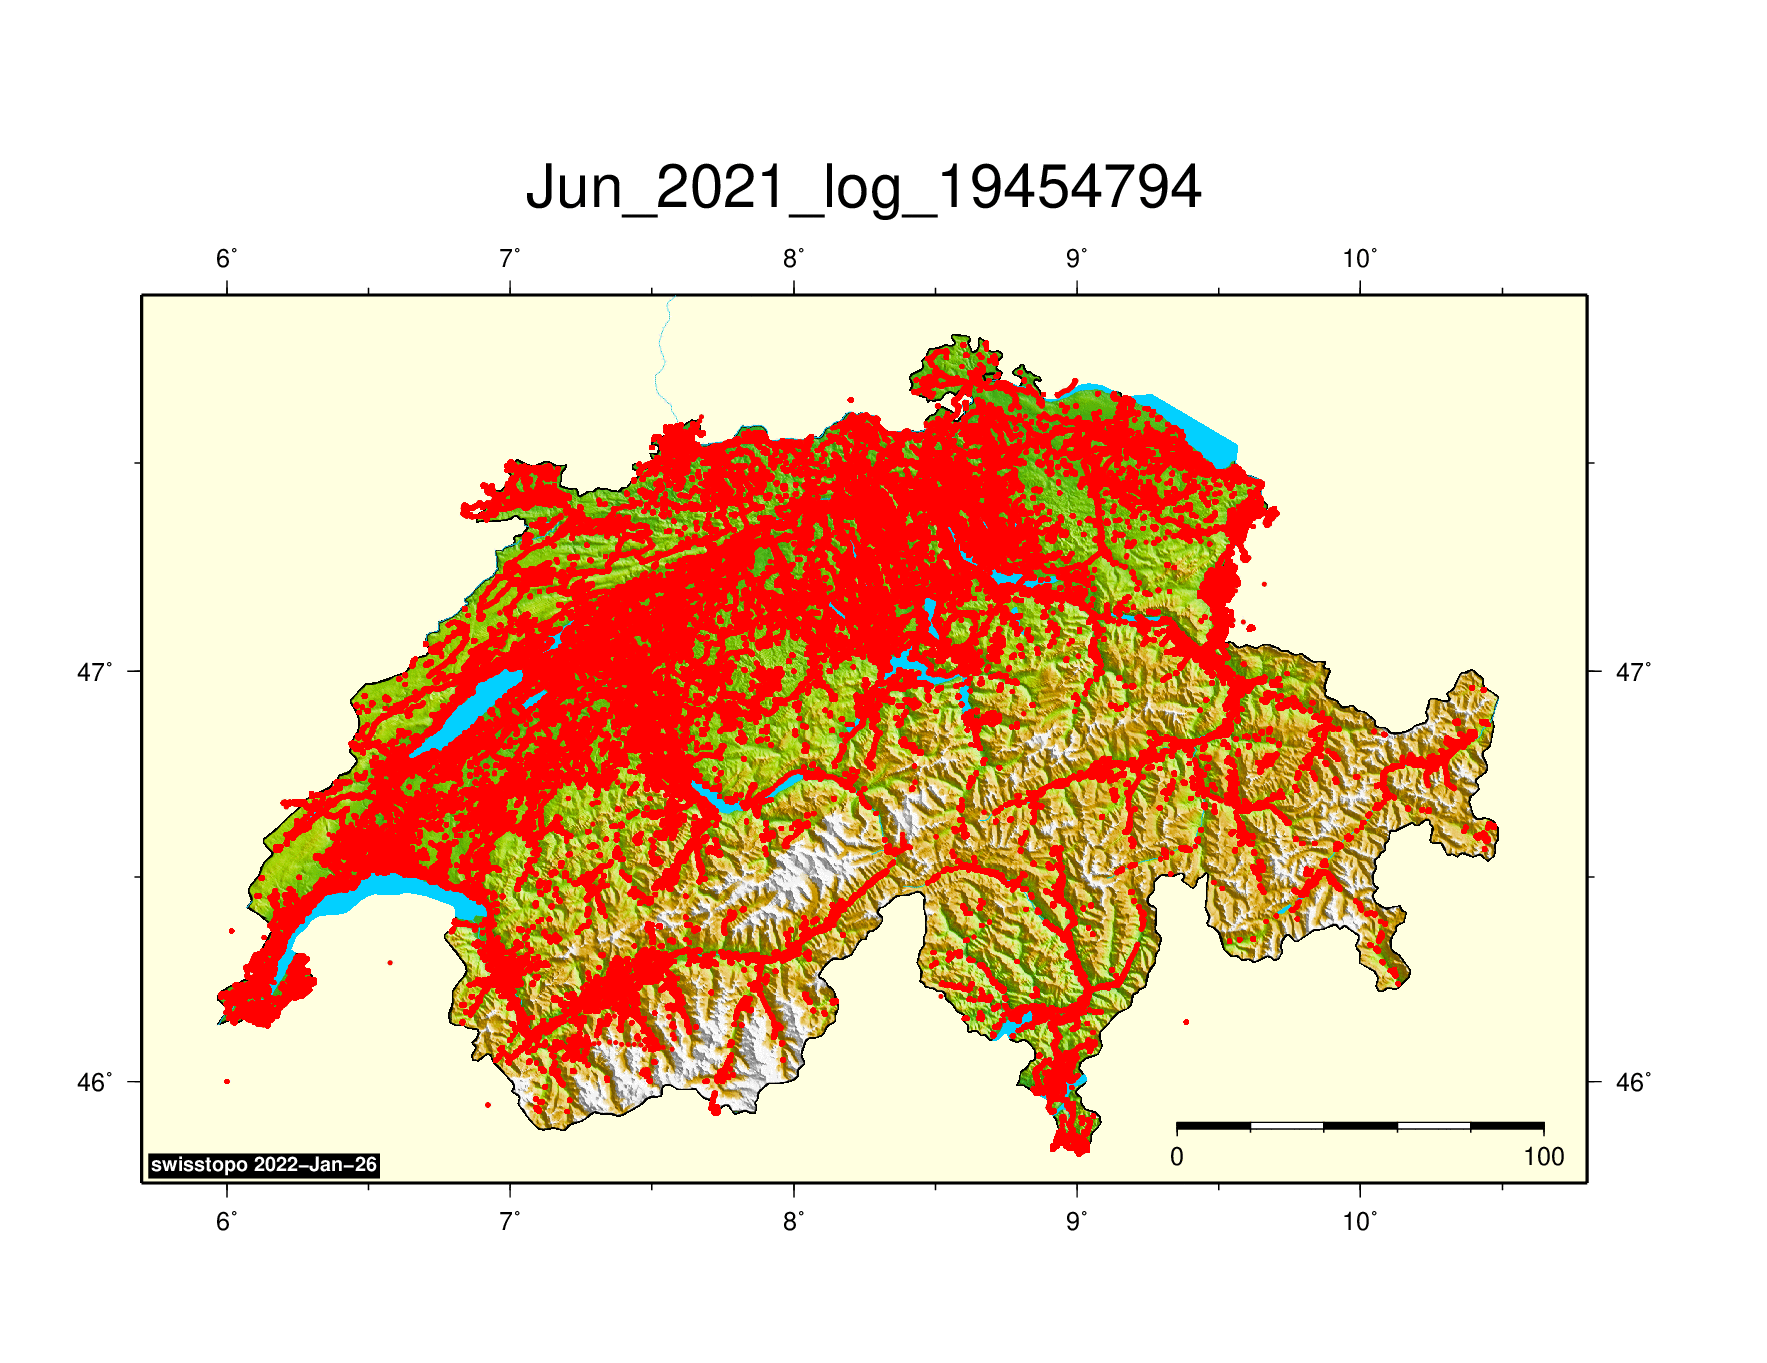
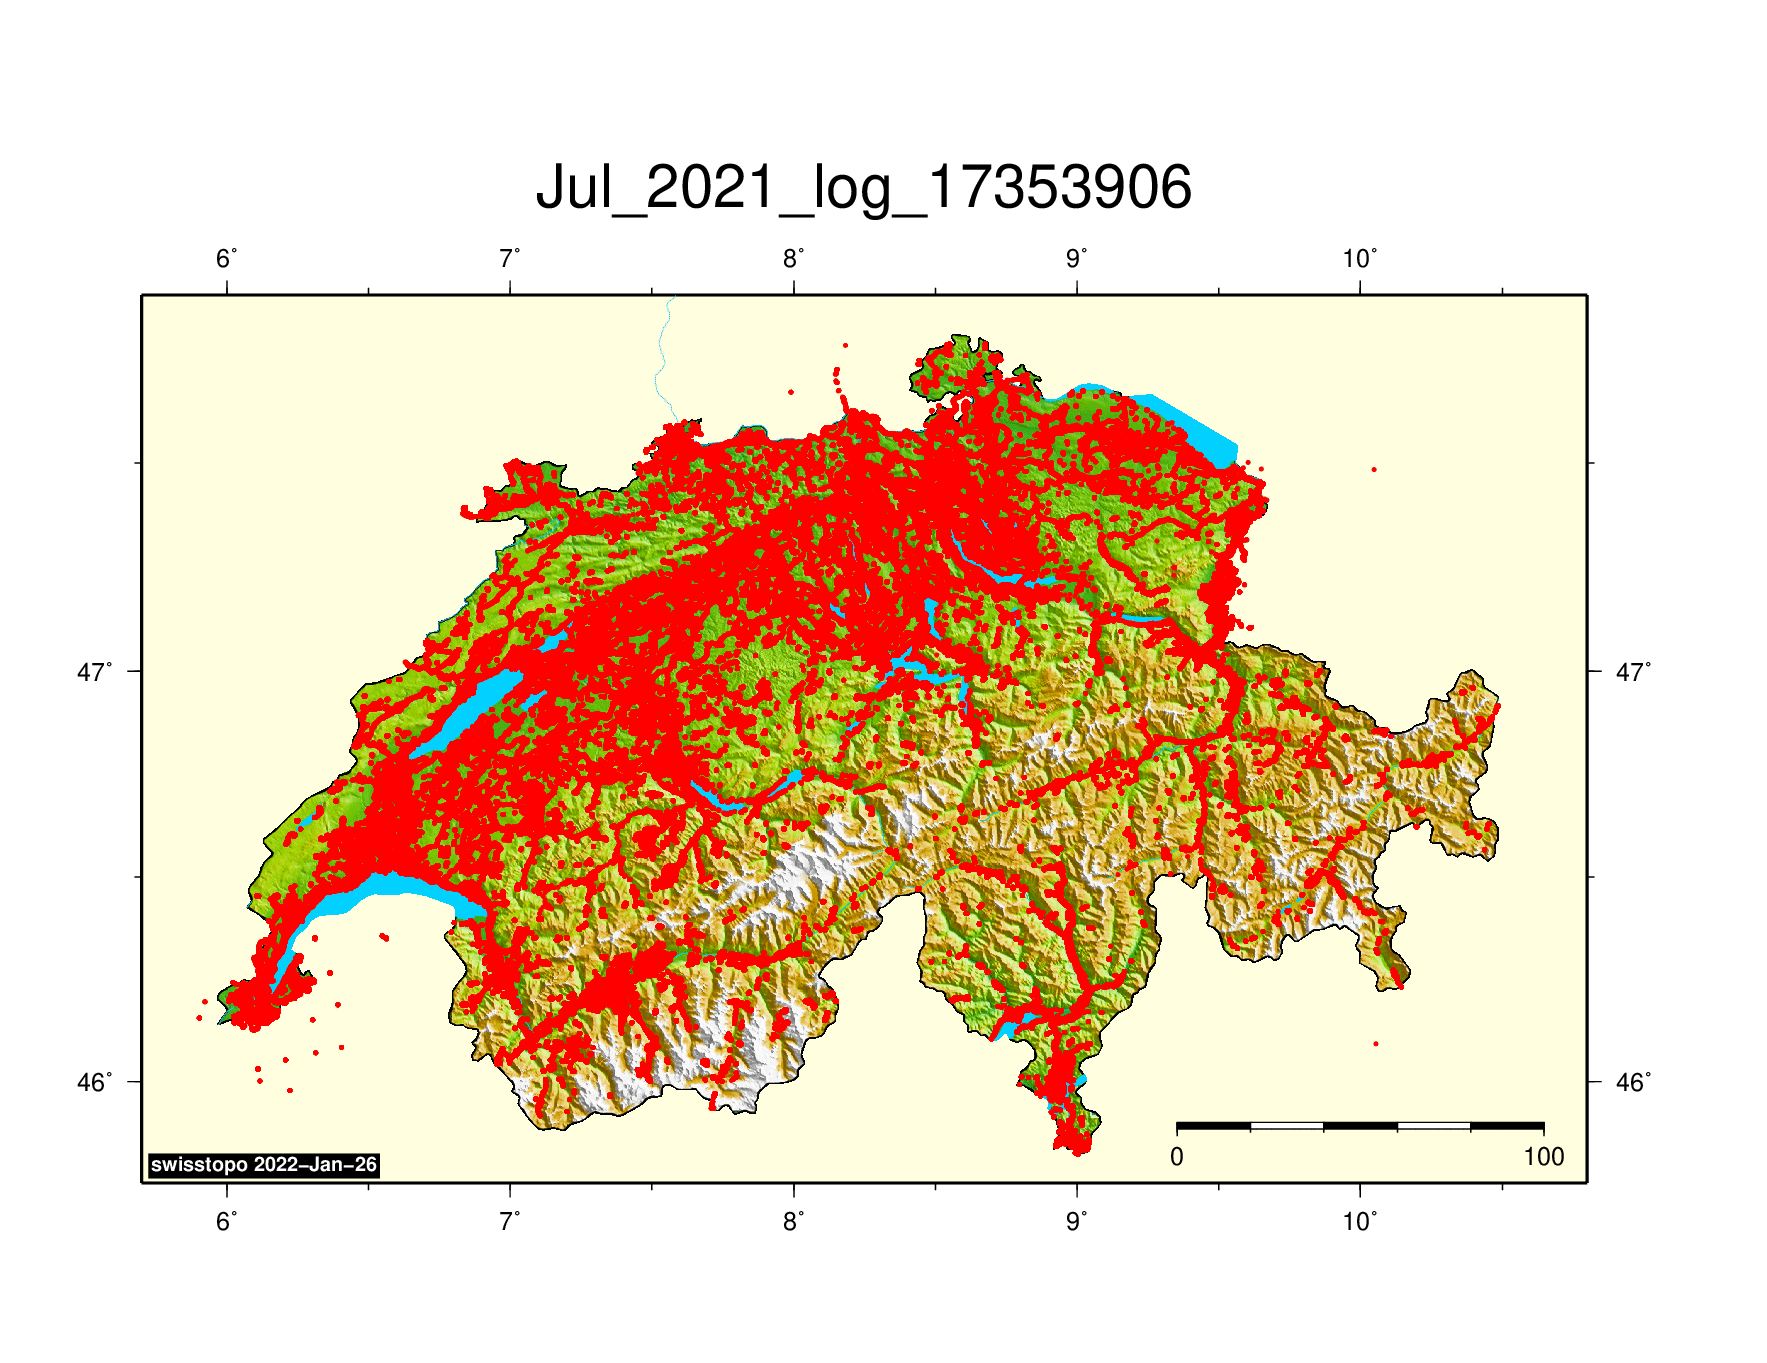
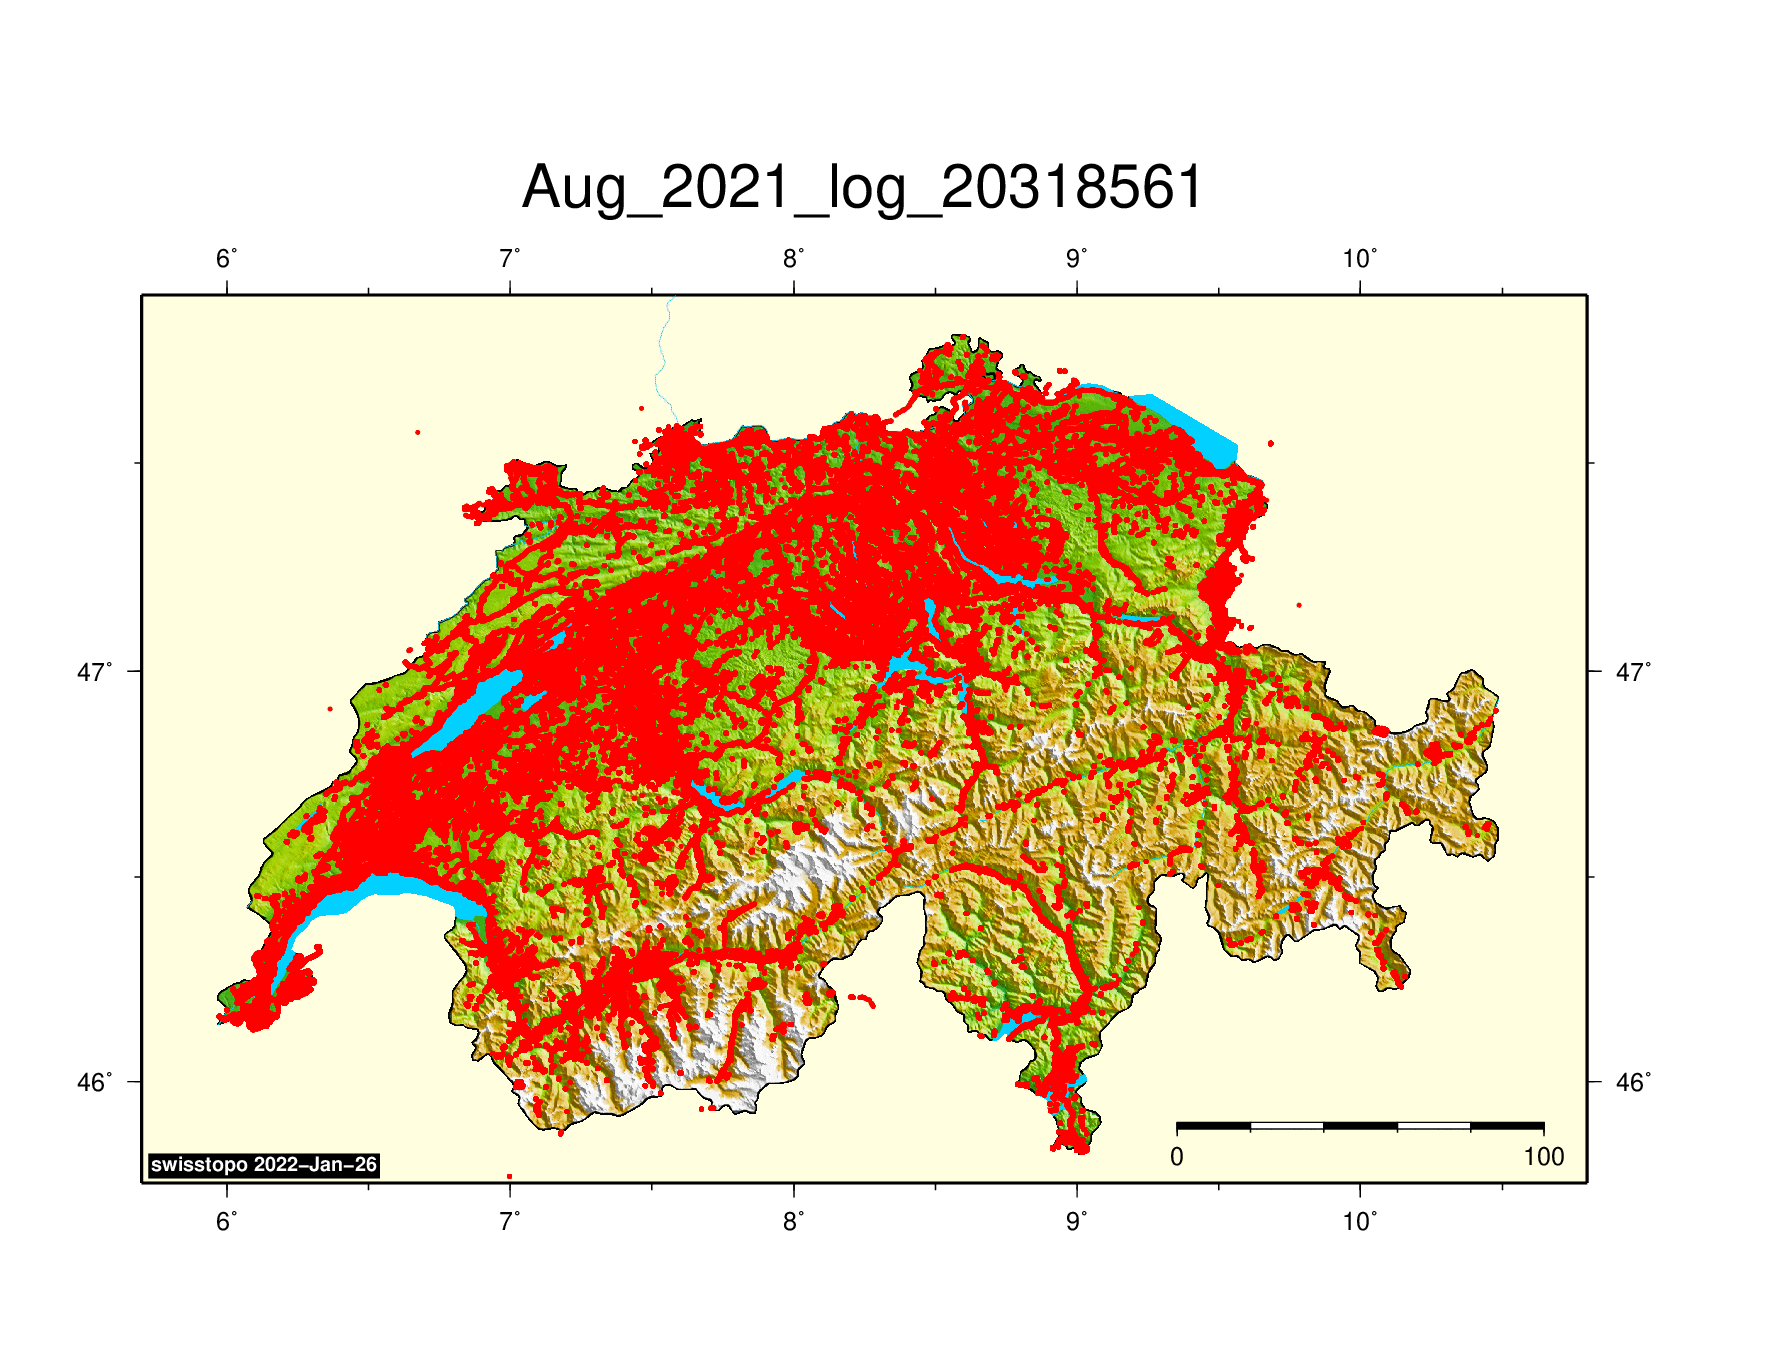
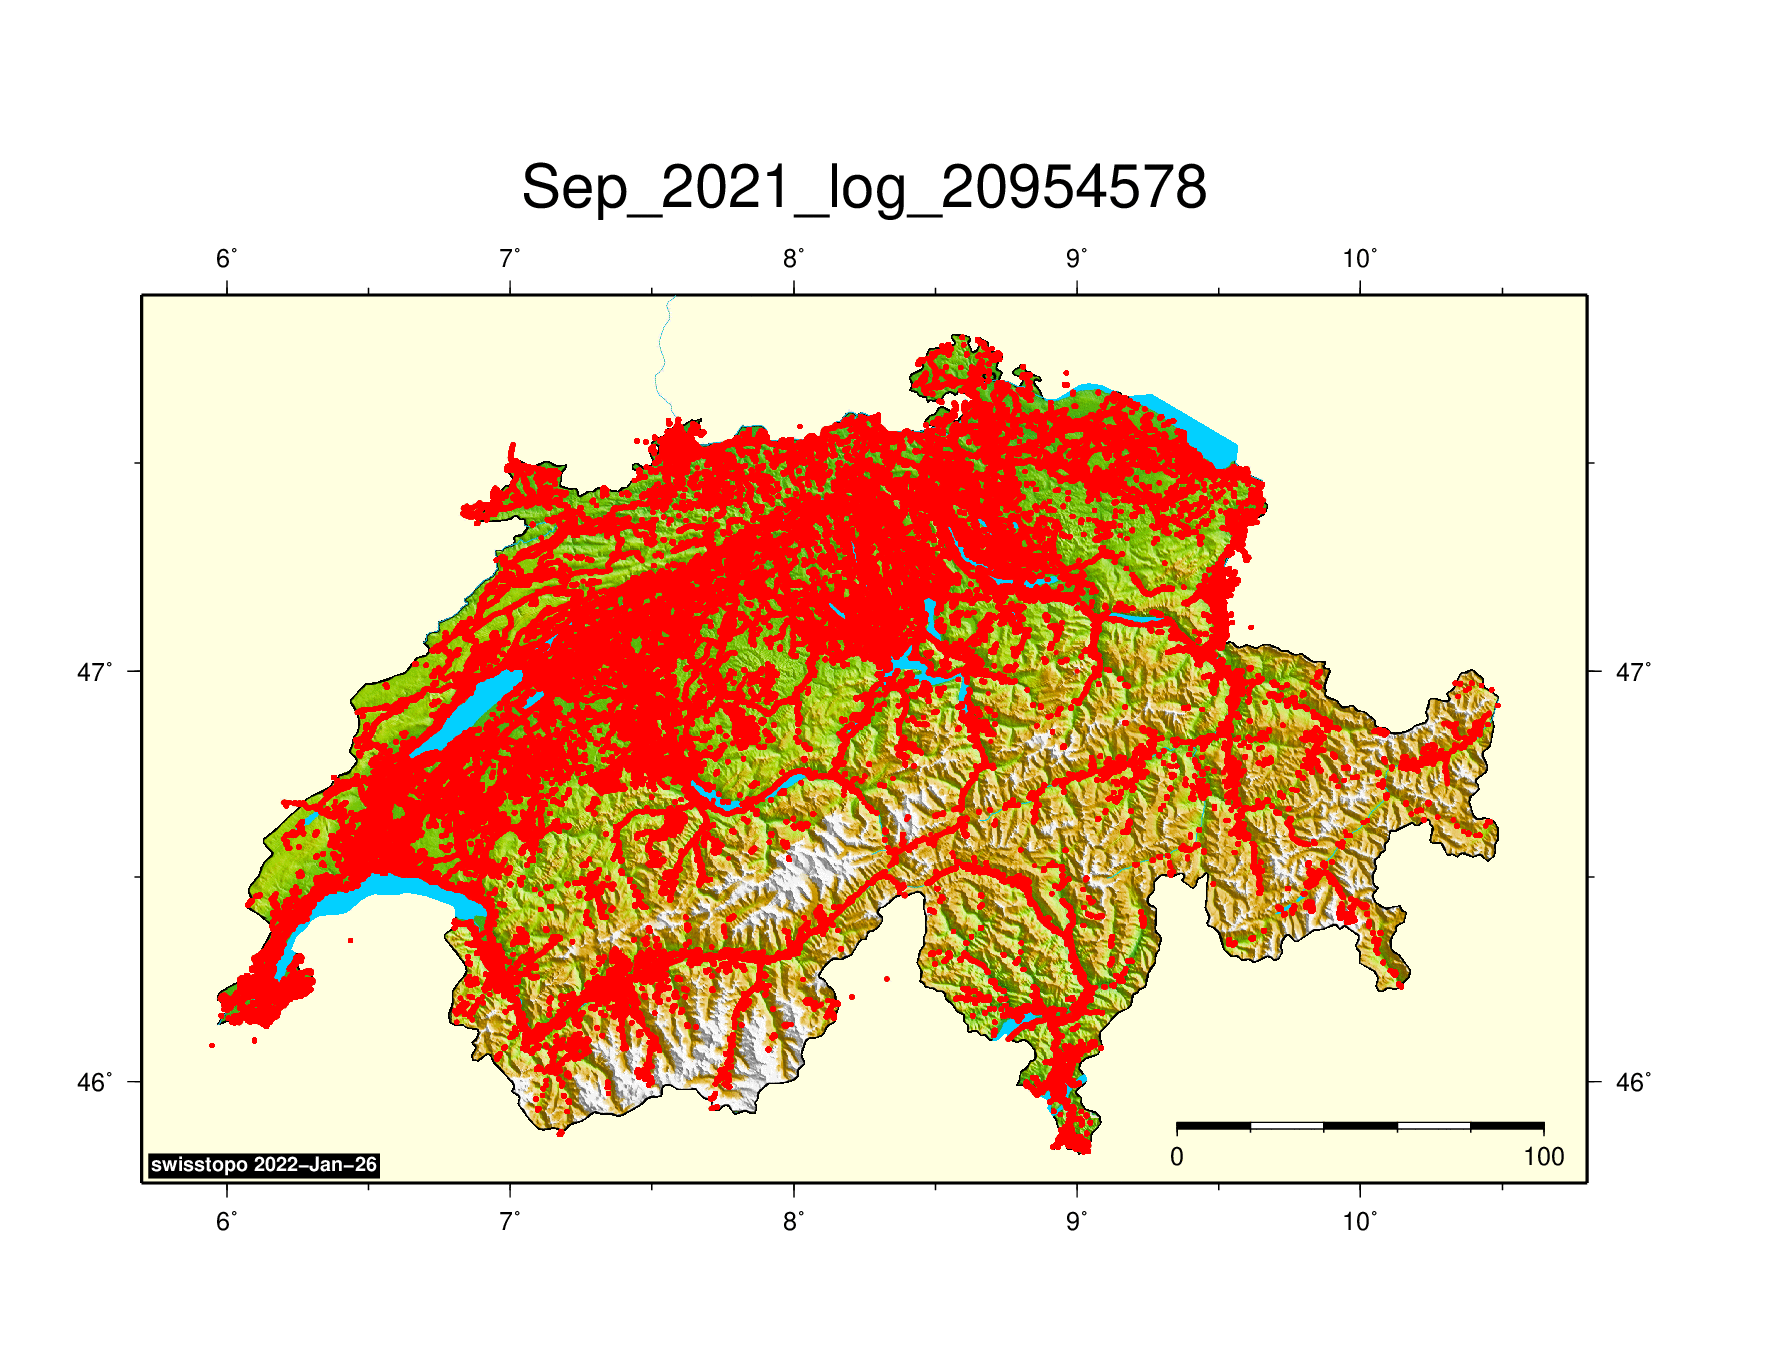
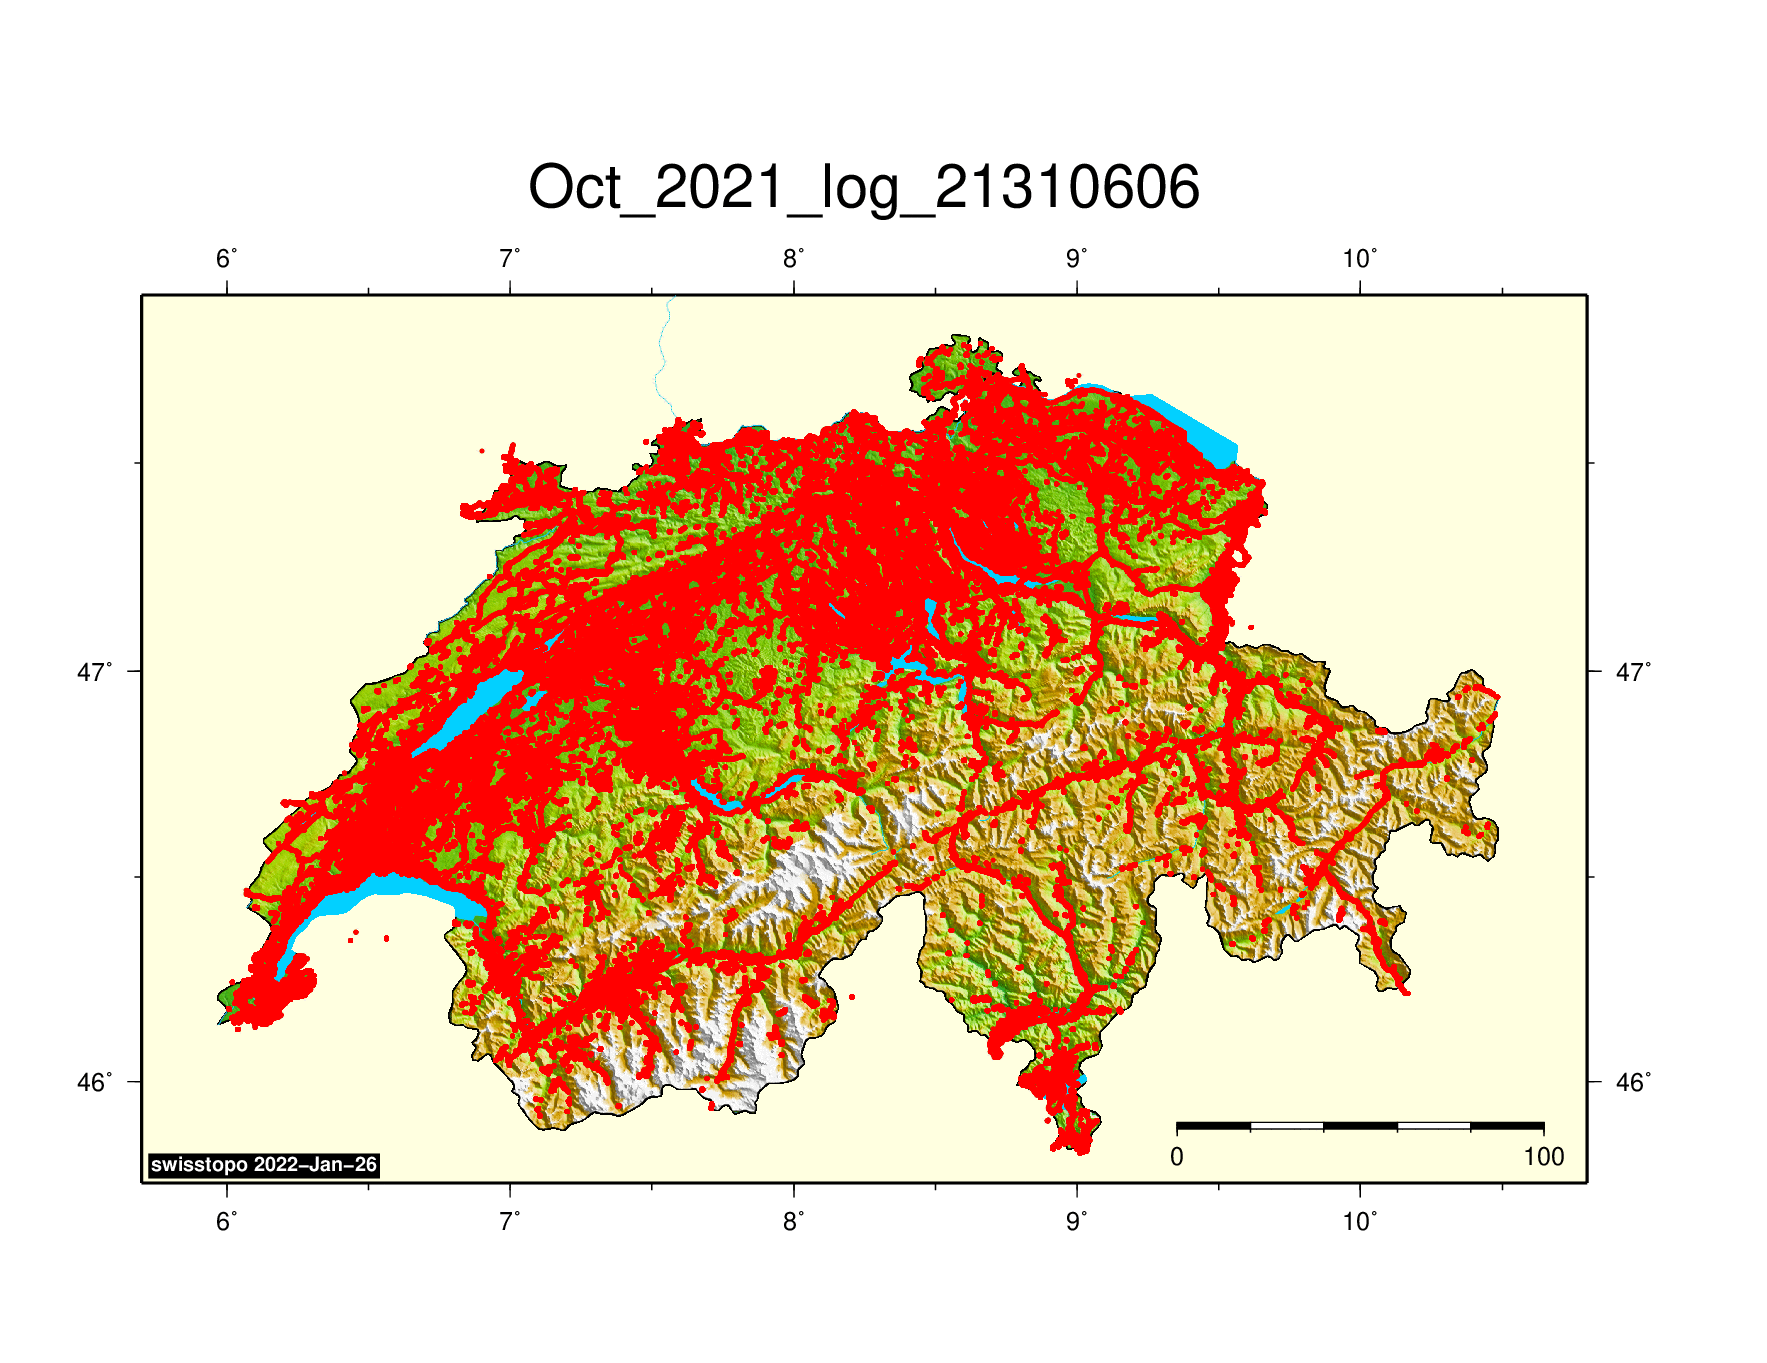
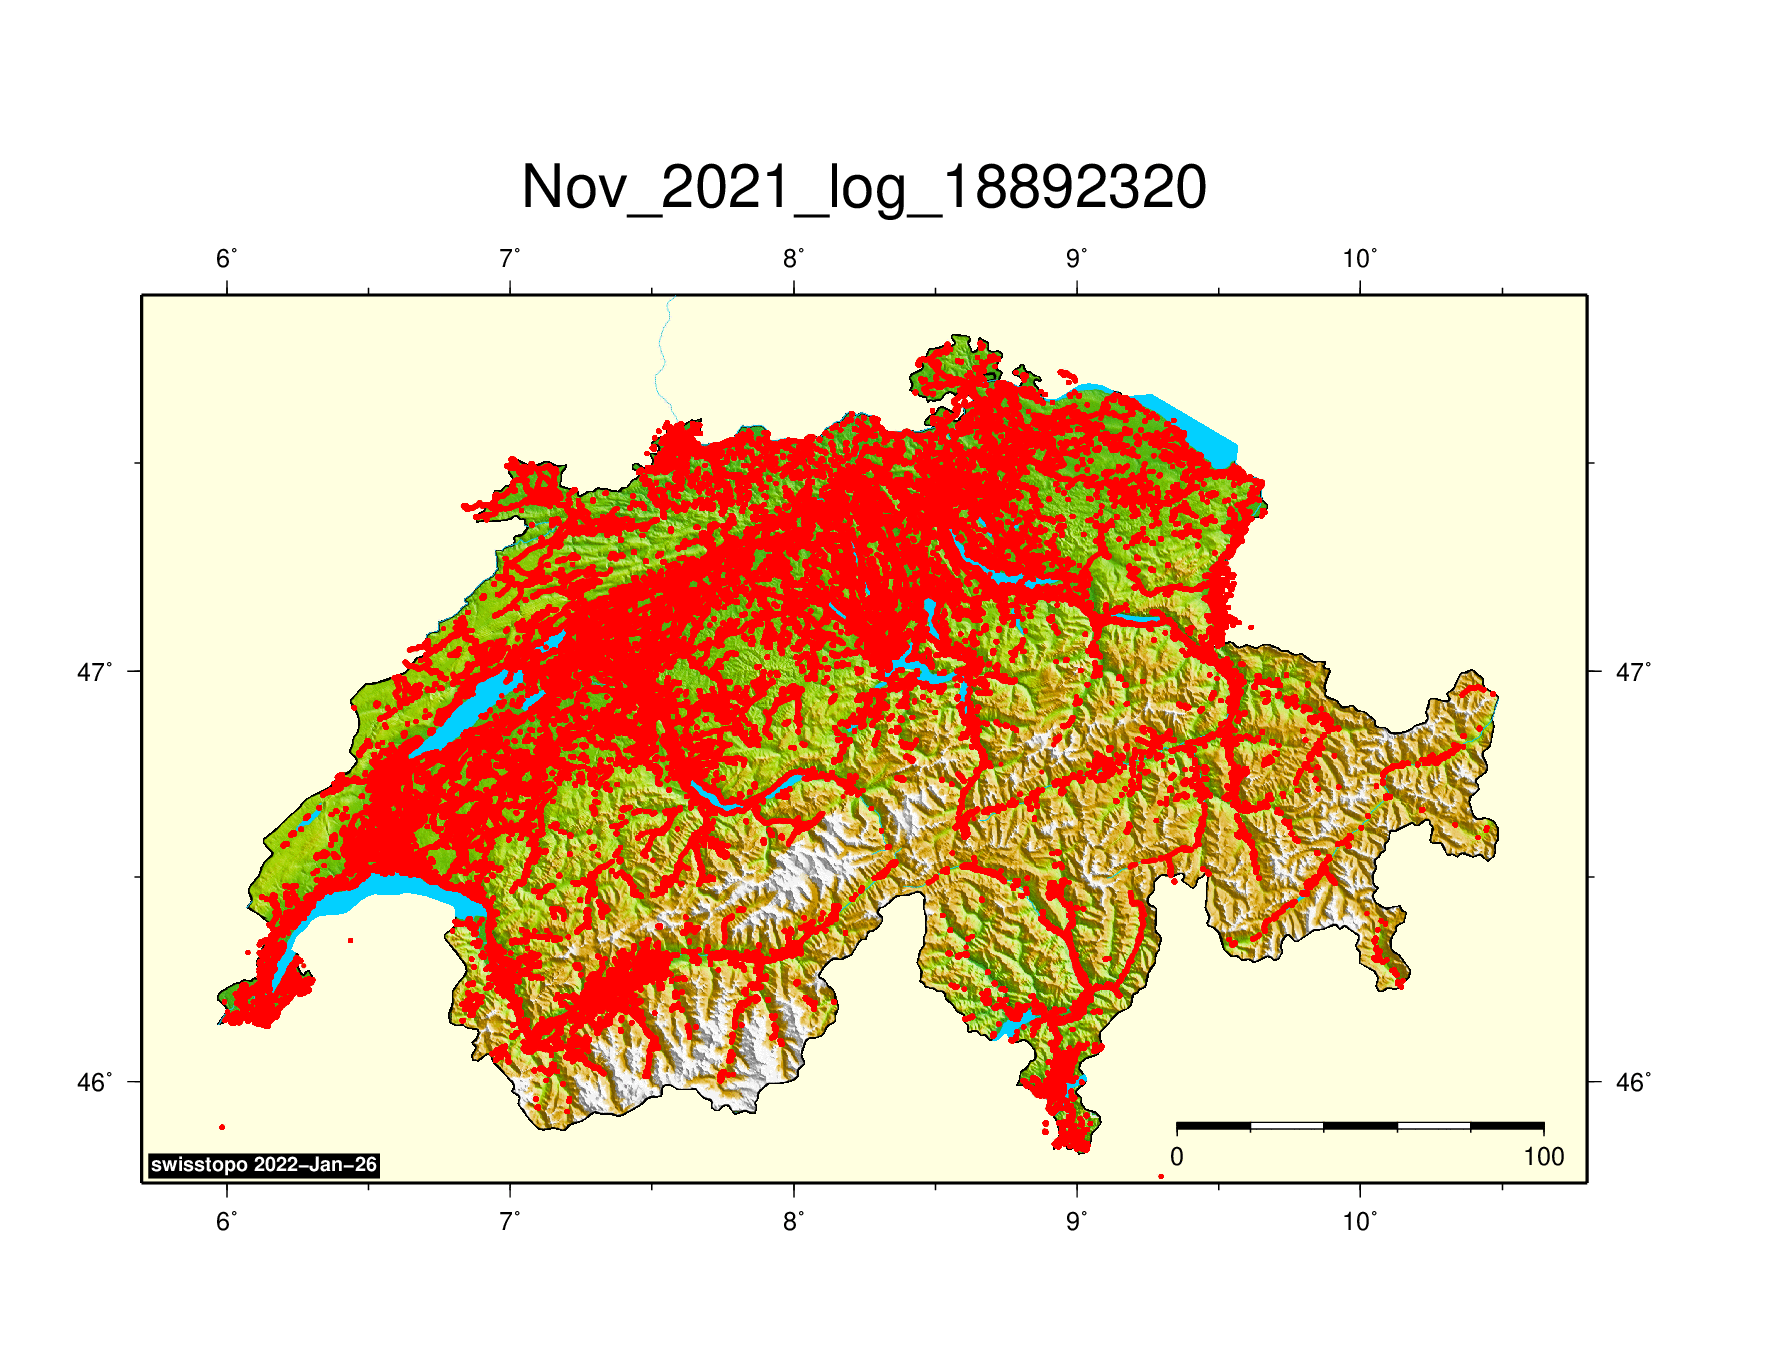
Positions animated (by month)Month and number of positions are shown in the title line. 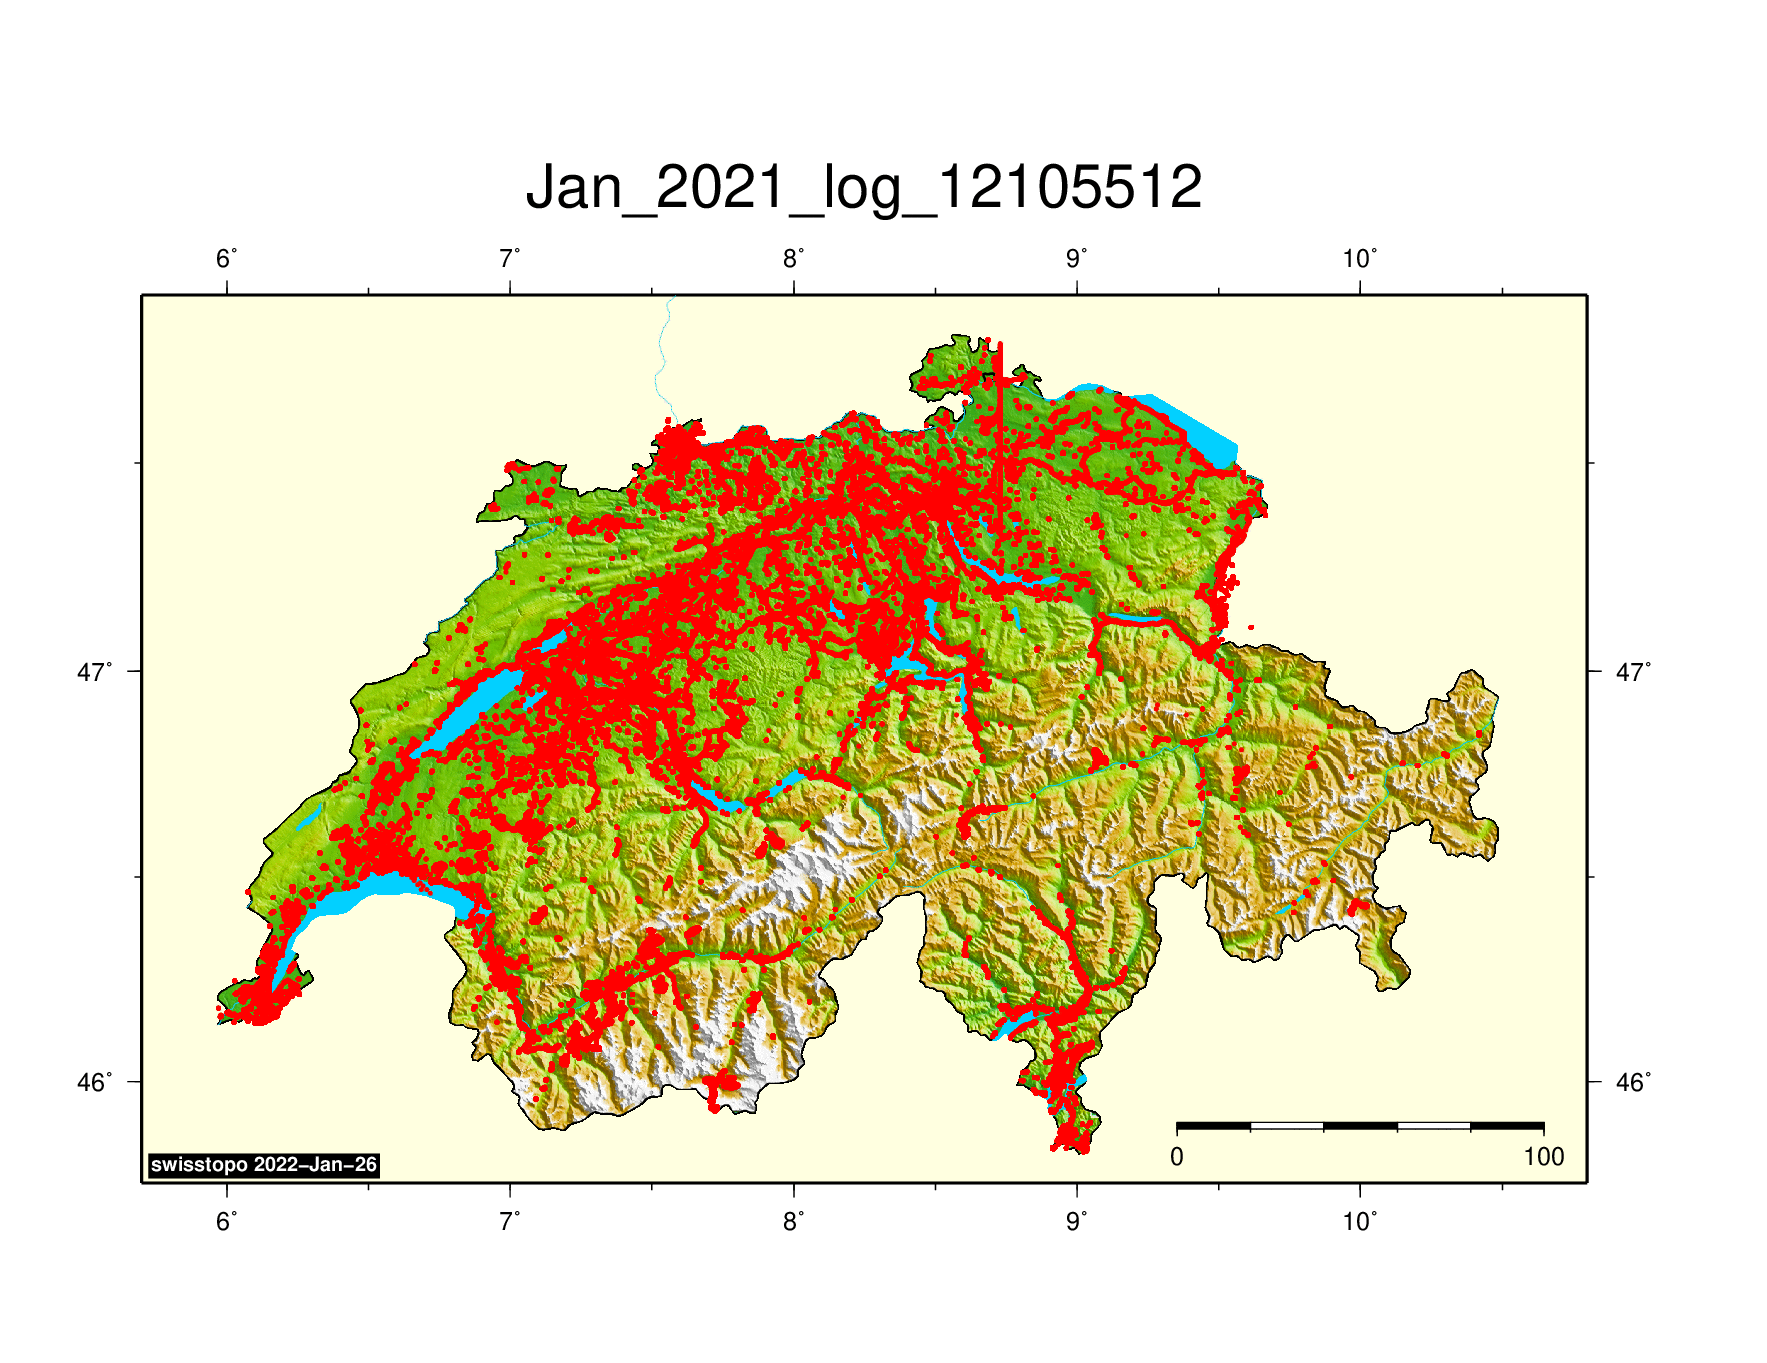
|
|
|
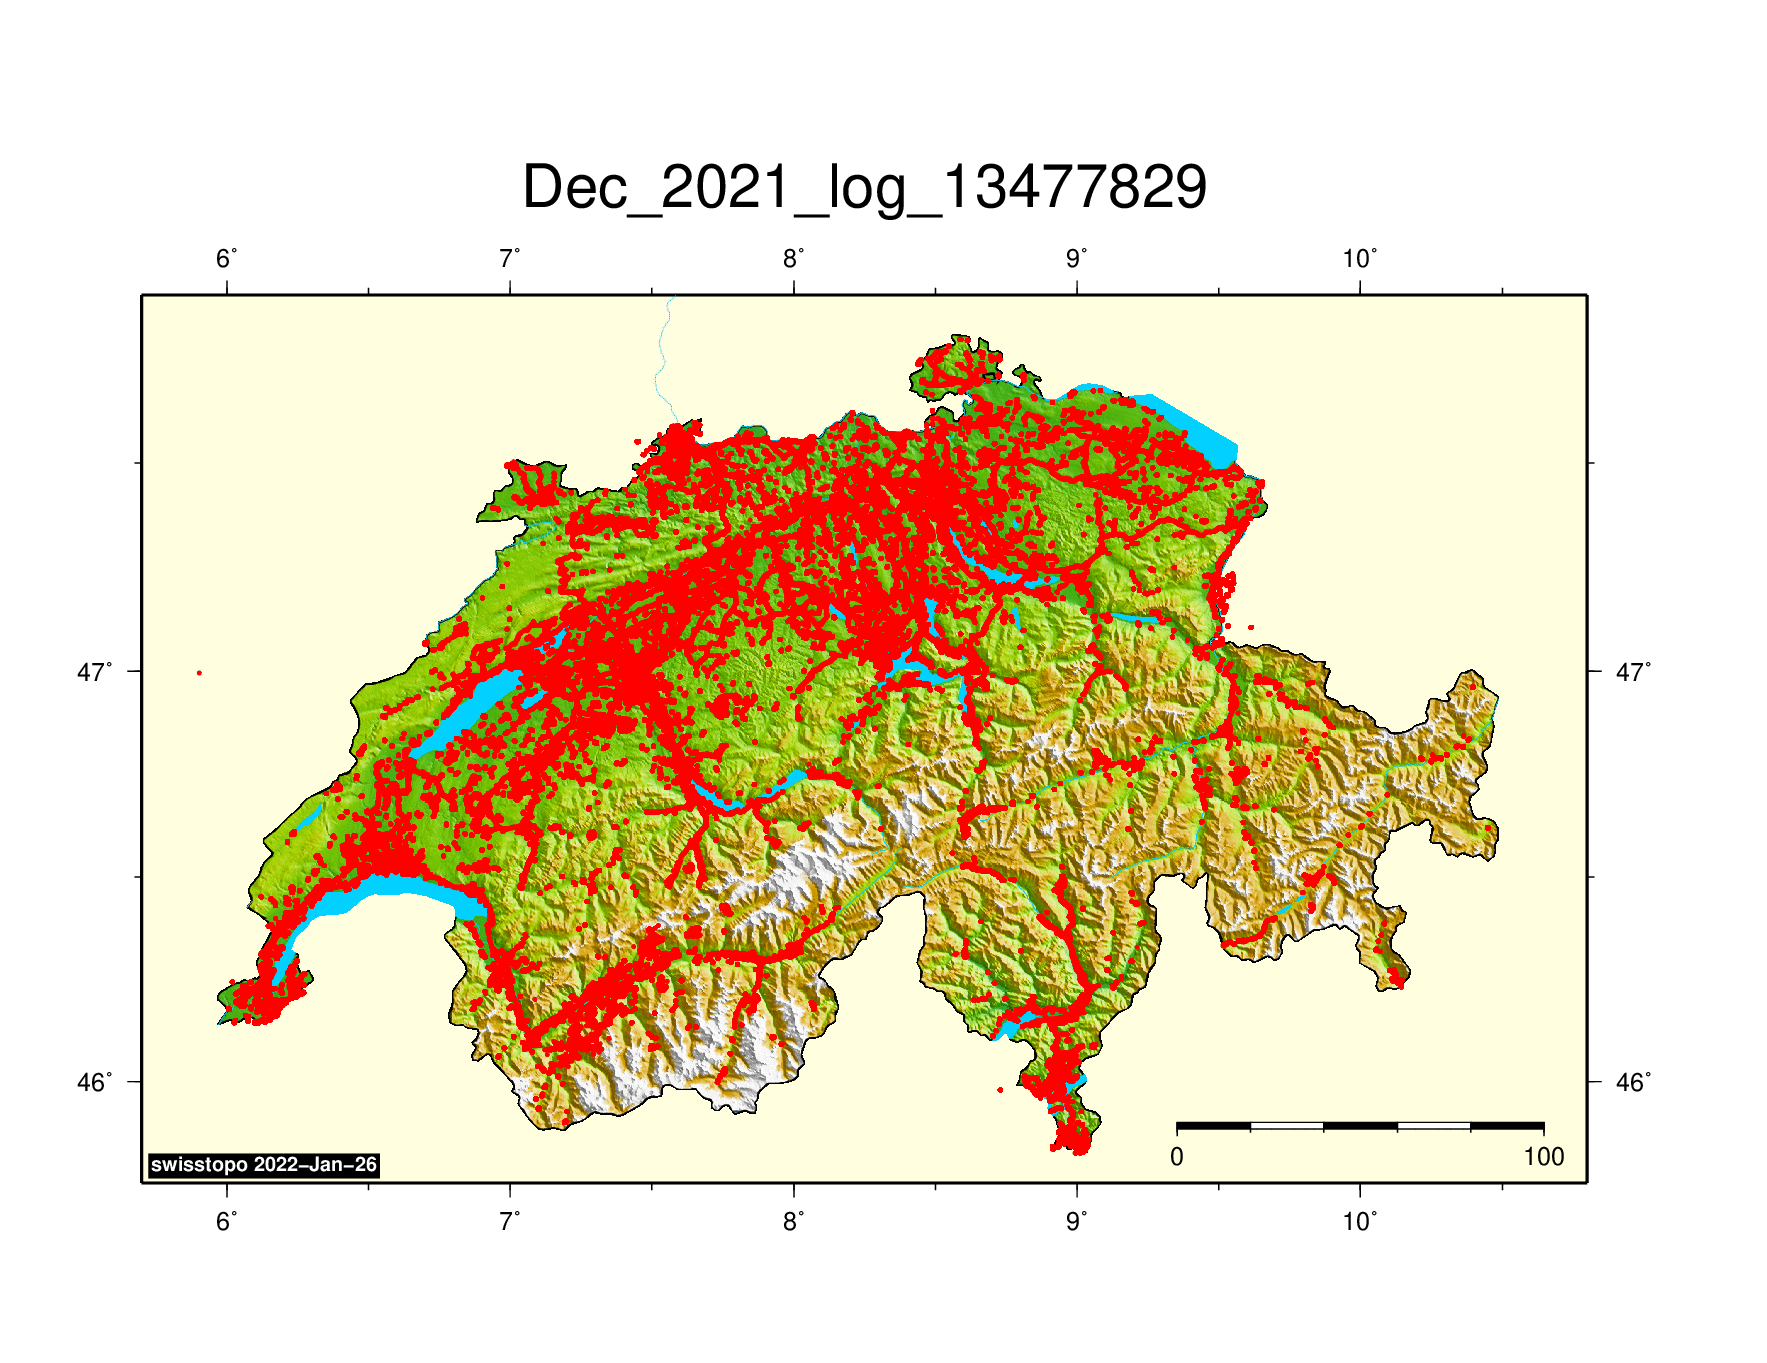
Positions (all year)222 Mio positions, in total. 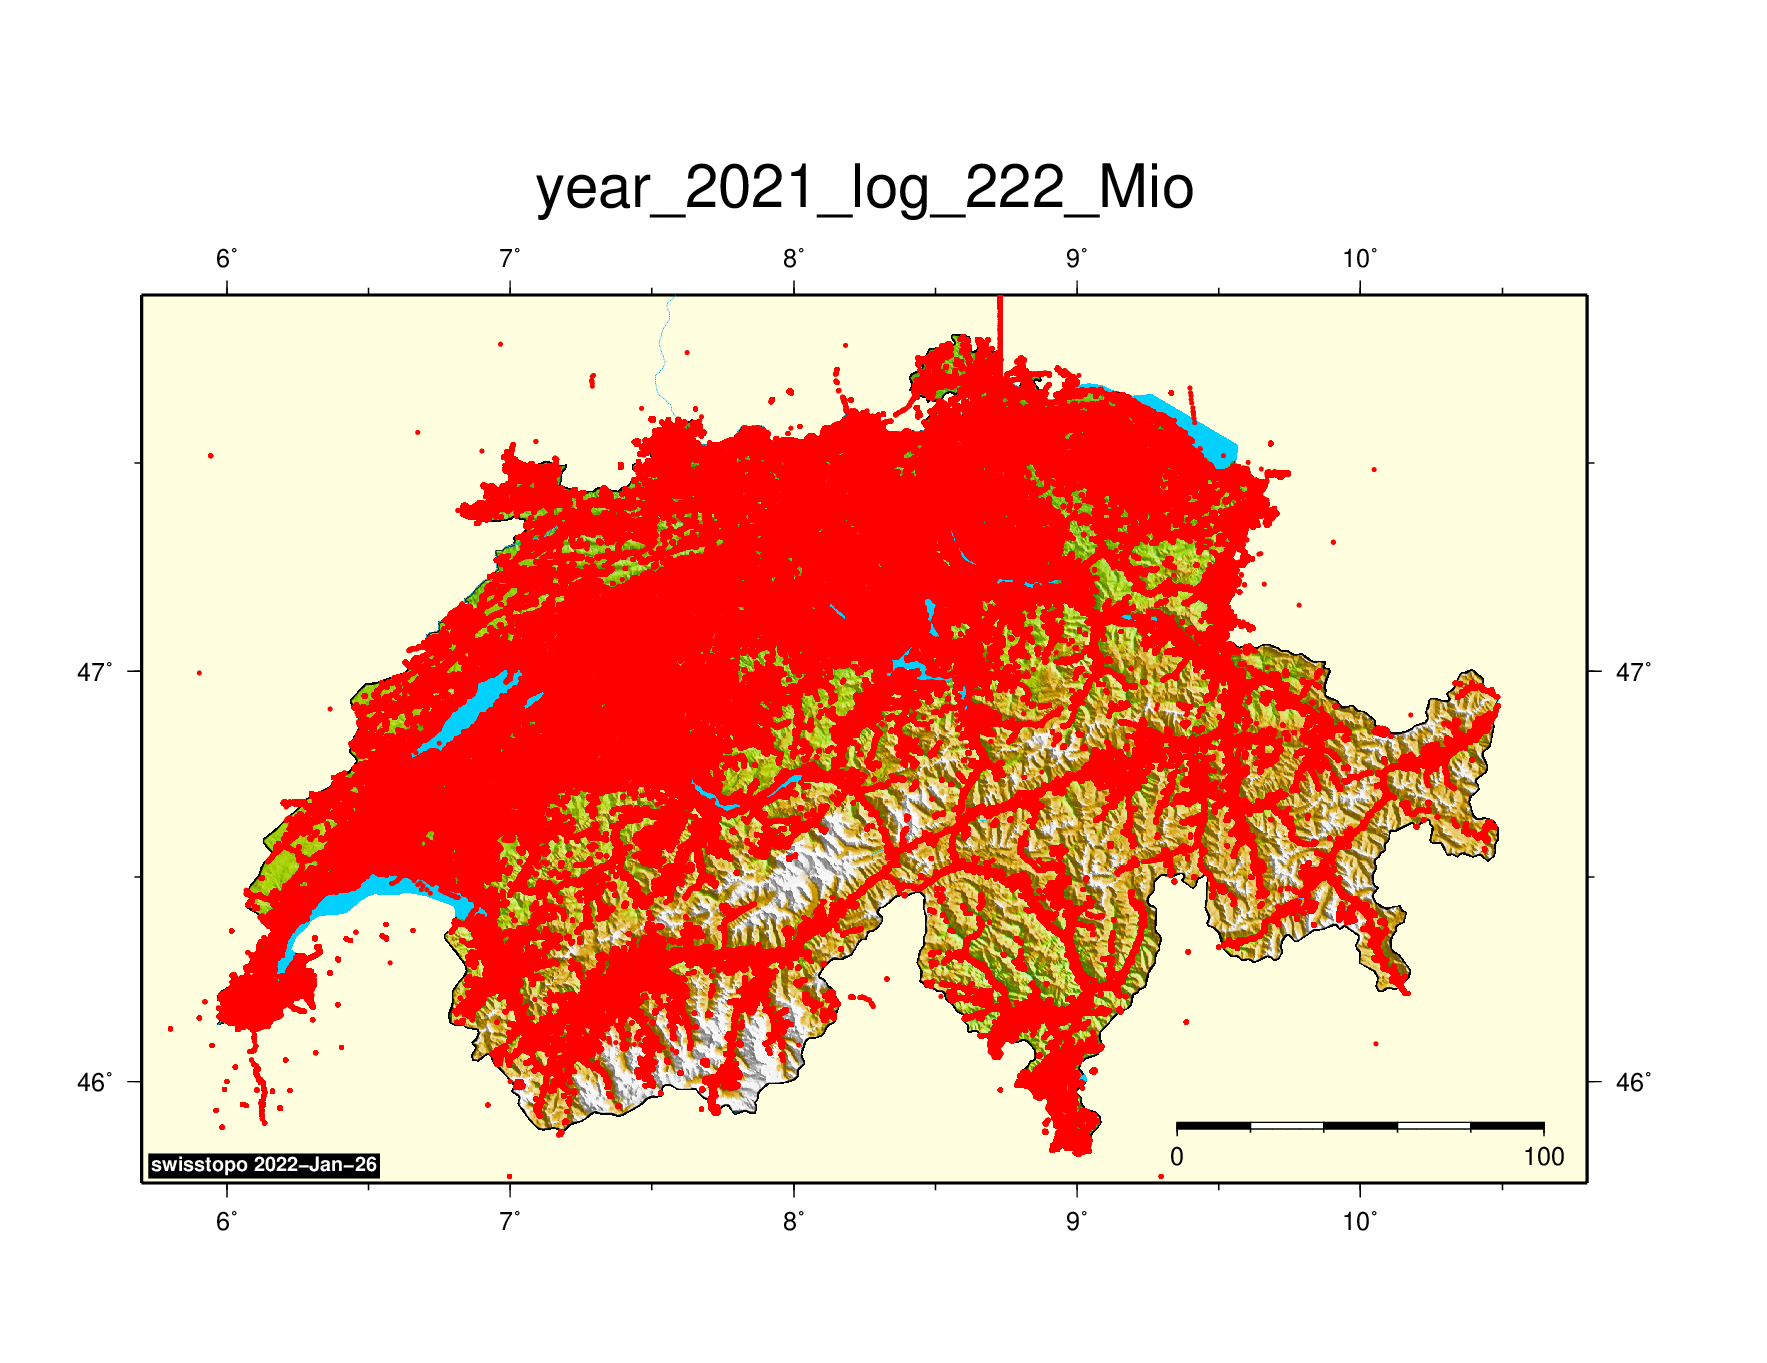
|
|
|
Positions RTK-fixed (all year)172 Mio positions RTK-fixed. 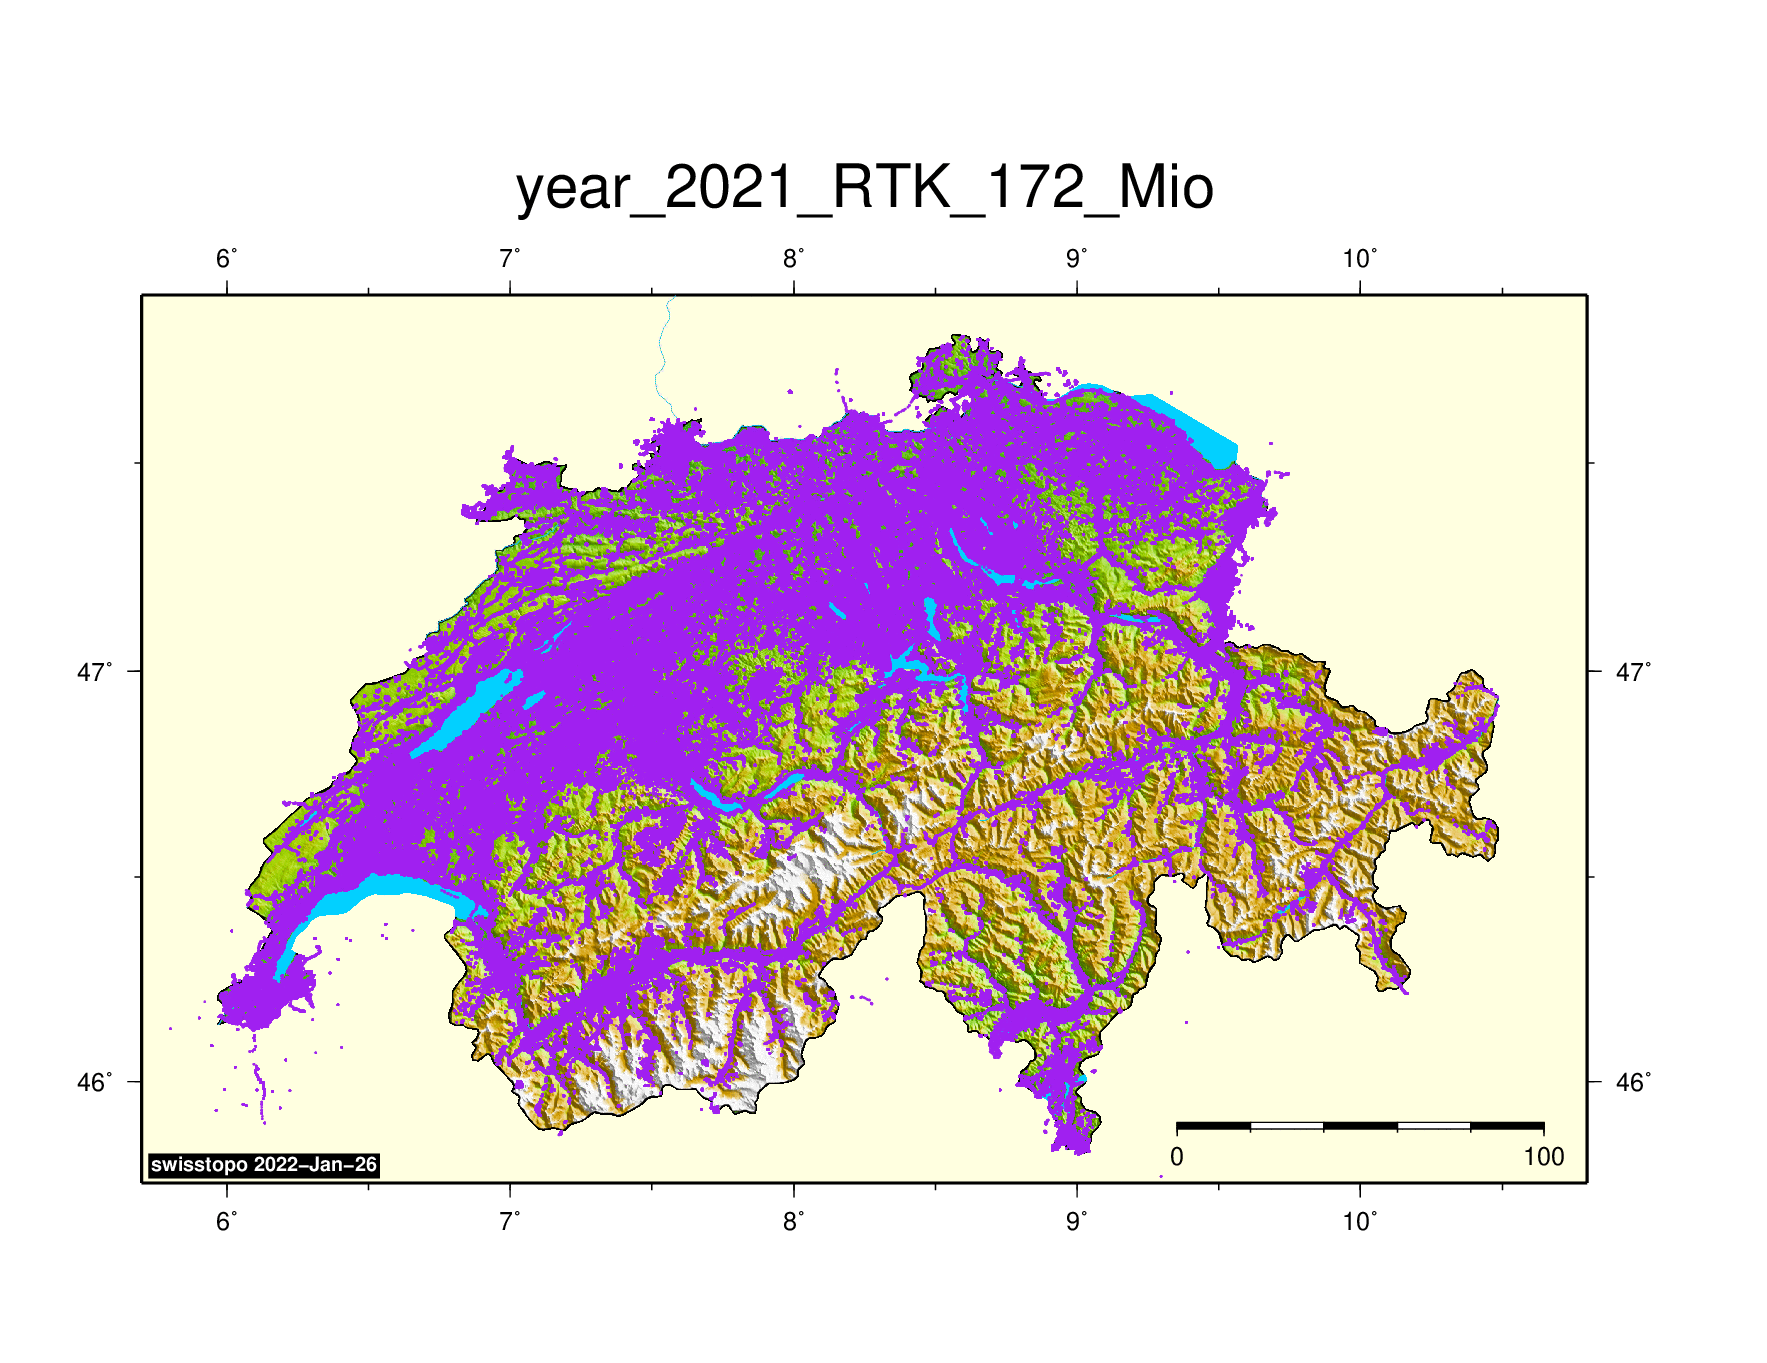
|
|
|
Positions DGNSS (all year)35 Mio positions DGNSS. 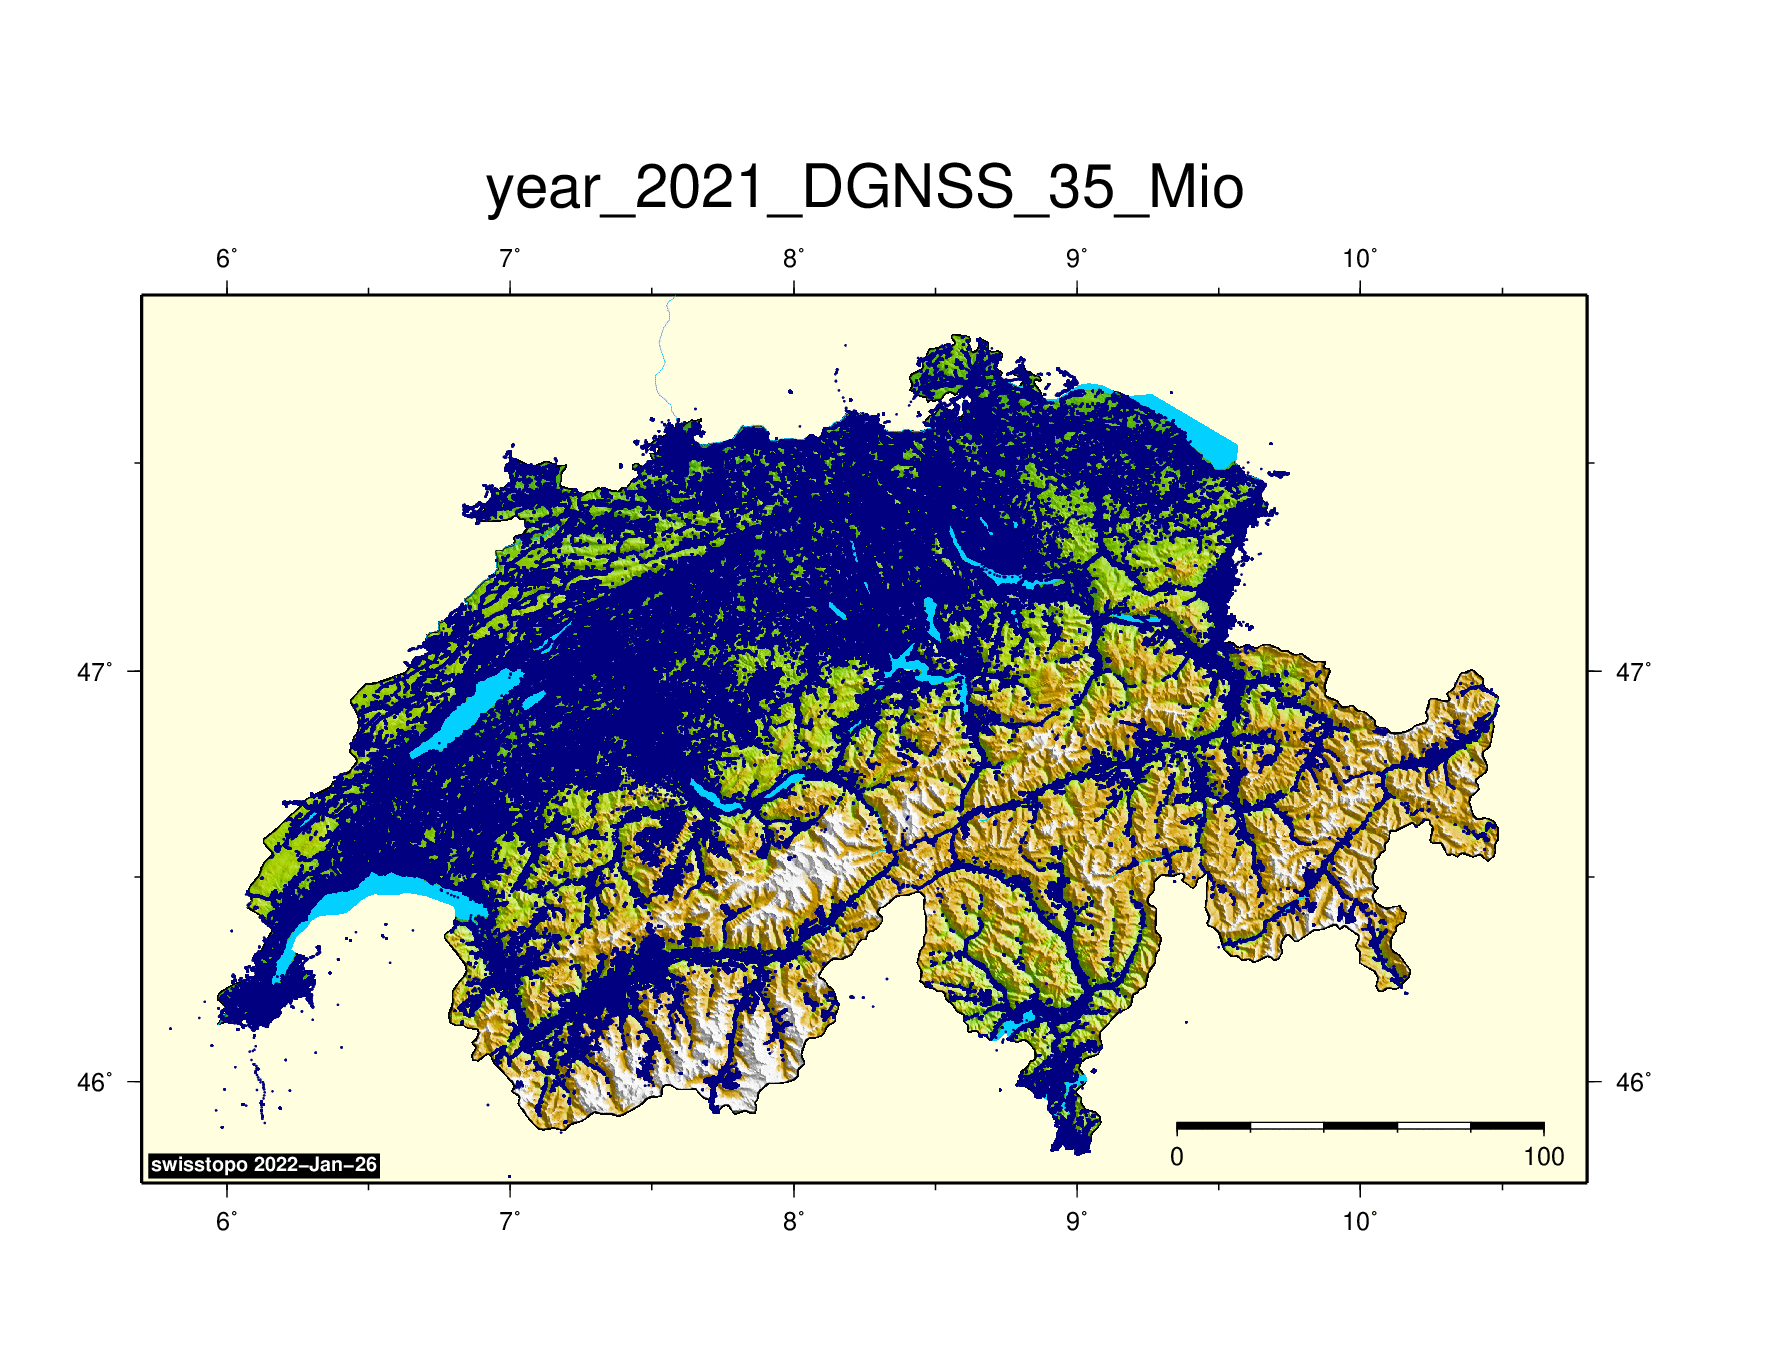
|
|
|
Density of usage (all year)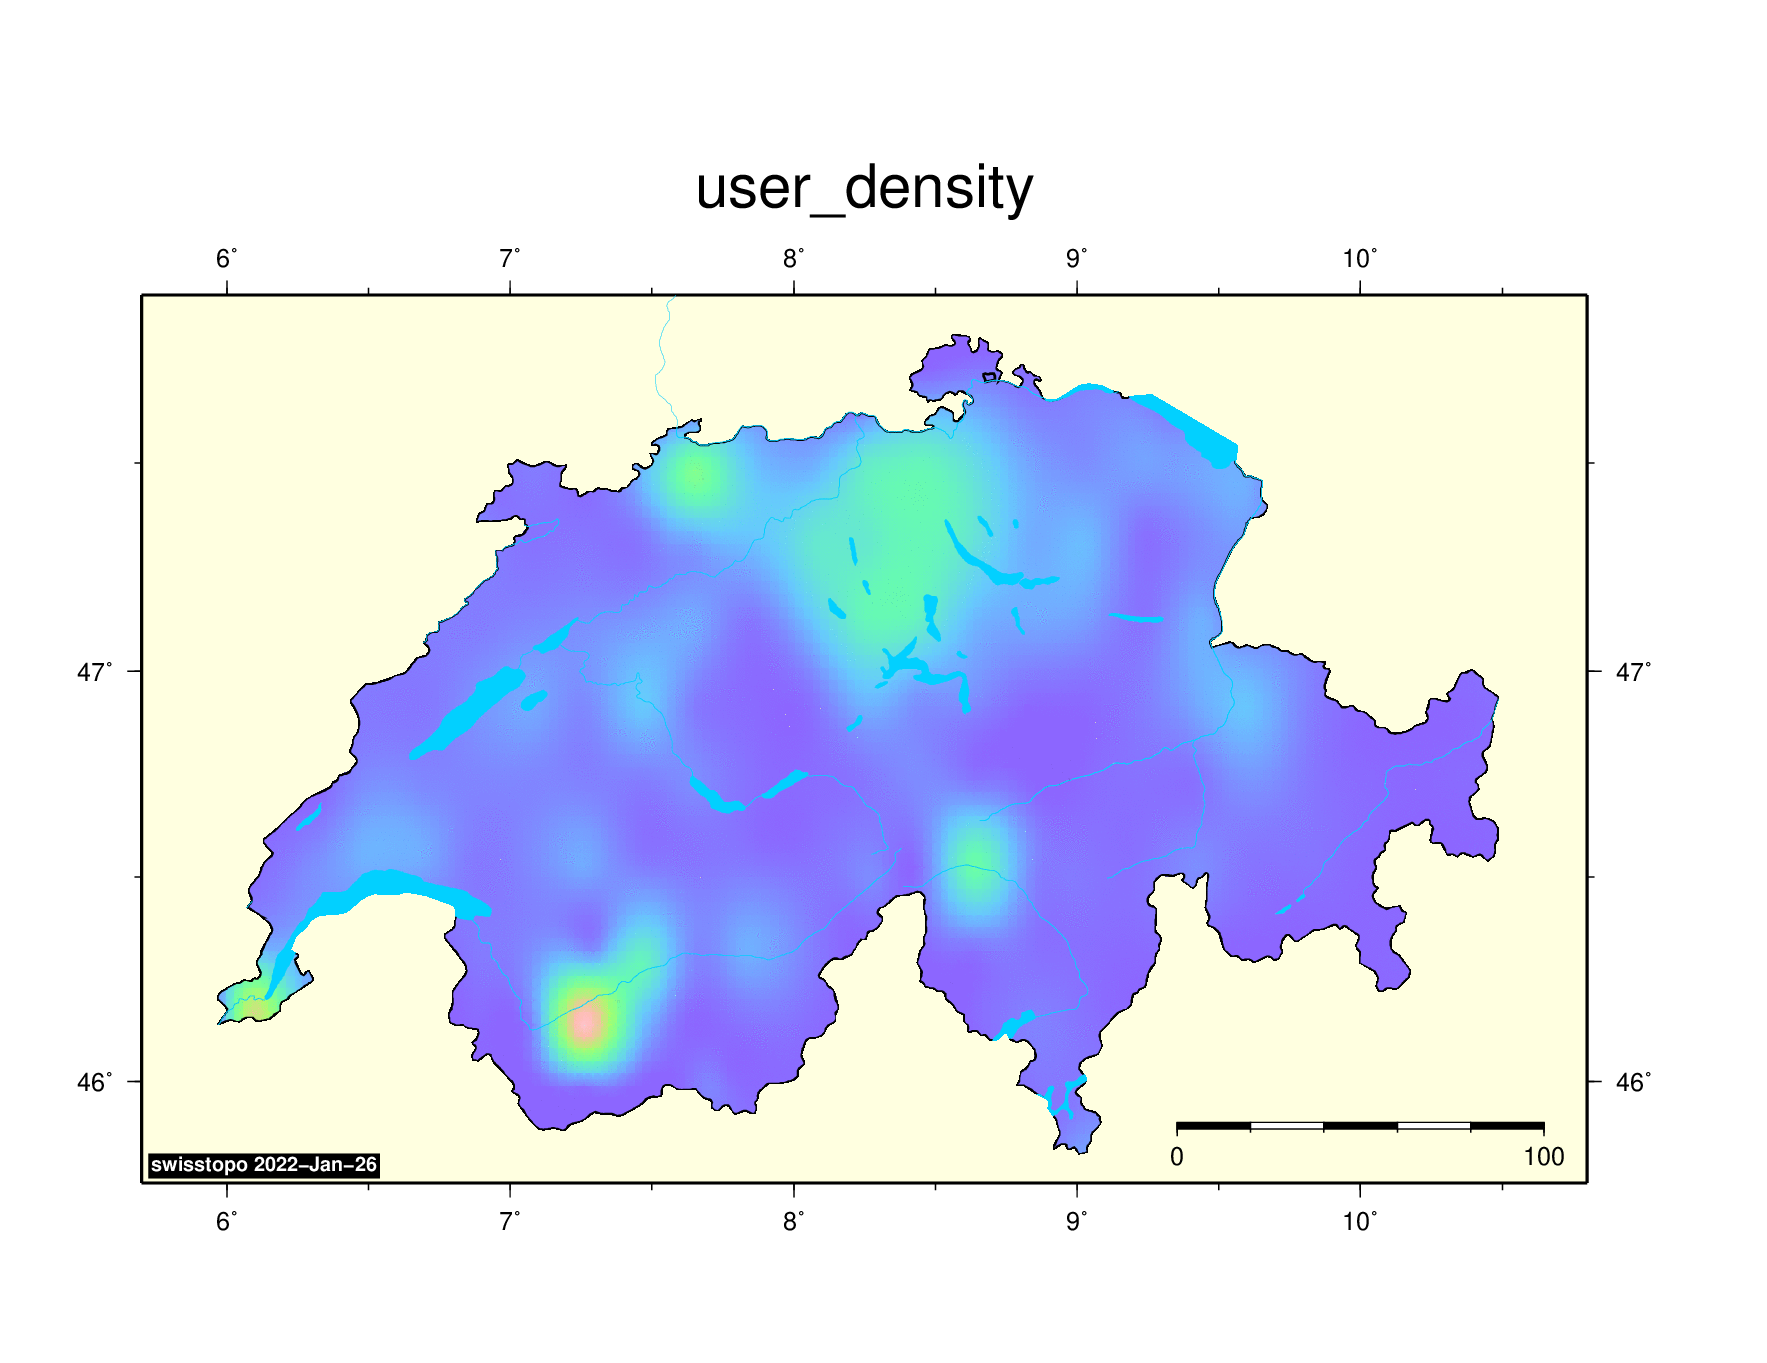
|
|
|
Positions (each month individually)Month and number of positions are shown in the title line. 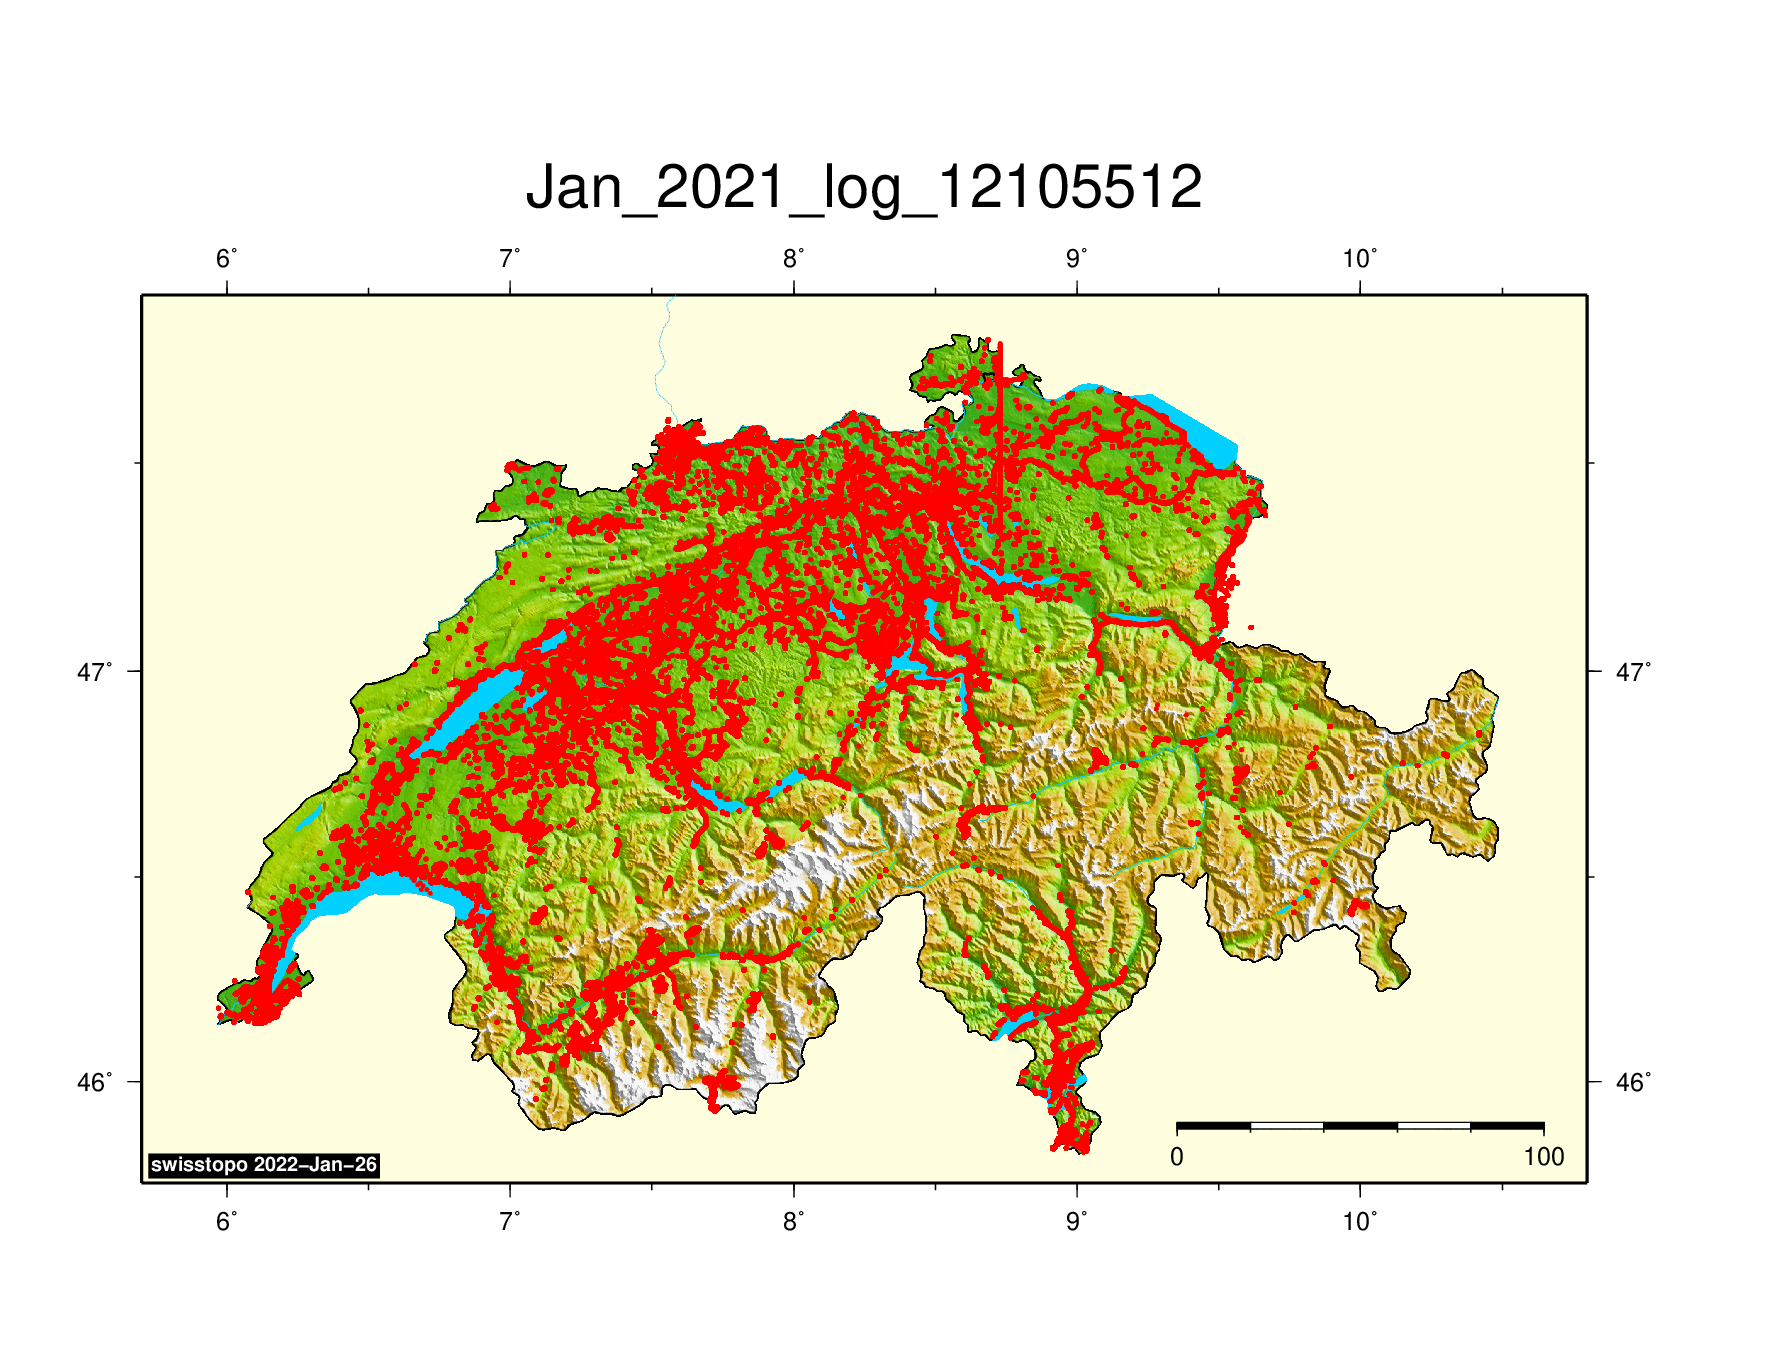
|
|
|
Summary MonthMore usage in spring and autumn (not linearily increasing with peak in summer as in 2020). 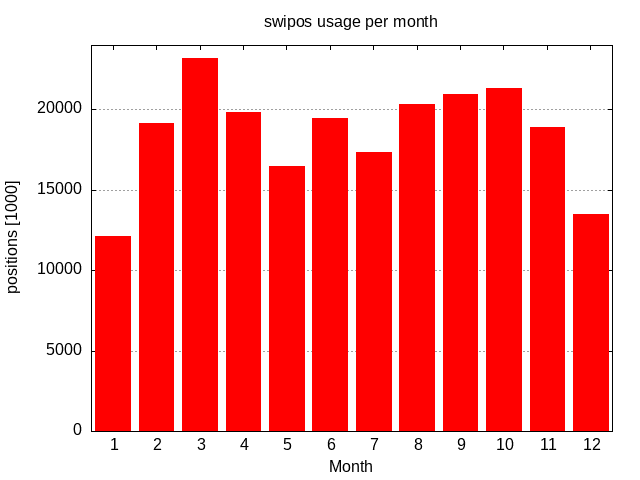
|
|
|
Summary Day of the yearDays with highest number of positions (usually, mid of week are most productive days of the week): 25-Feb-2021 Thu. Doy 56 1'988'766 positions 20-Oct-2021 Wed. Doy 293 1'336'979 positions 01-Jun-2021 Tue. Doy 152 1'194'403 positions 52 days > 1'000'000 positions per day (2020, 3 days) 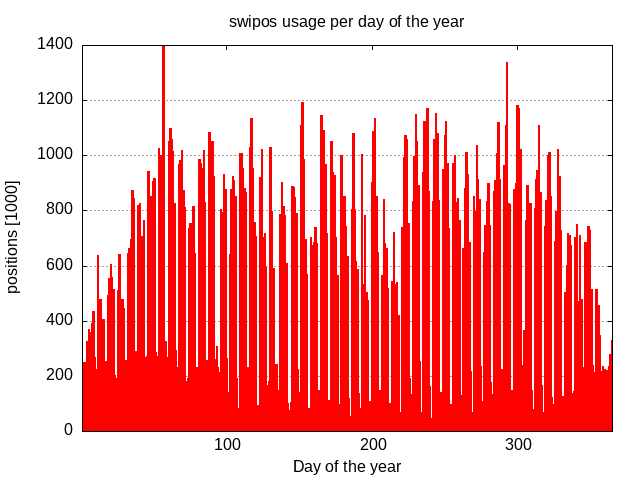
|
|
|
Summary HourHour [UTC]. Mid-day low point during lunch break. 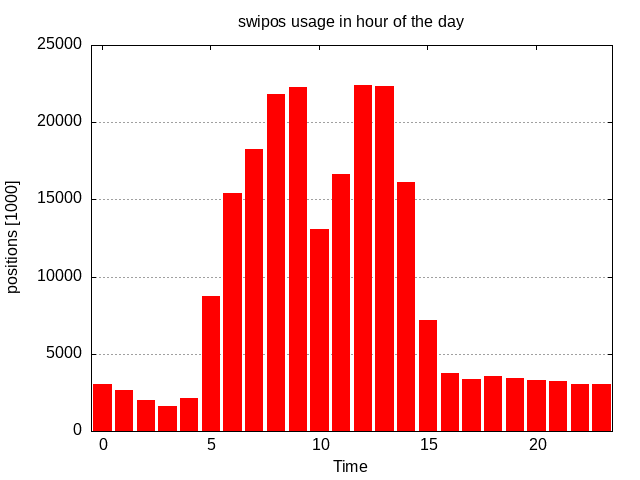
|
|
|
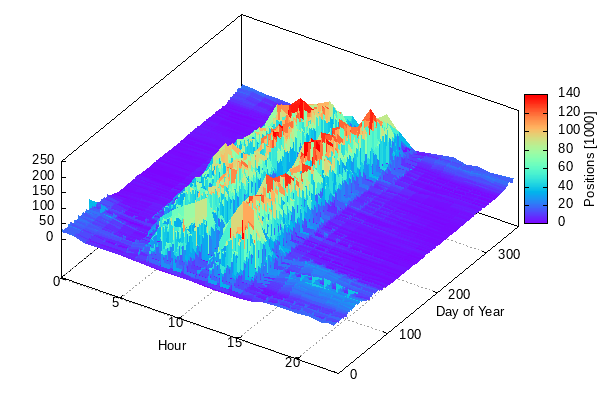
Day time of position for each day of the yearHour [UTC]. Winter-summer time switches, mid-day low point during lunch break, weekends and public holidays. ski season visible by snowcat navigation during night. Christmas days: more activity in night than at day. 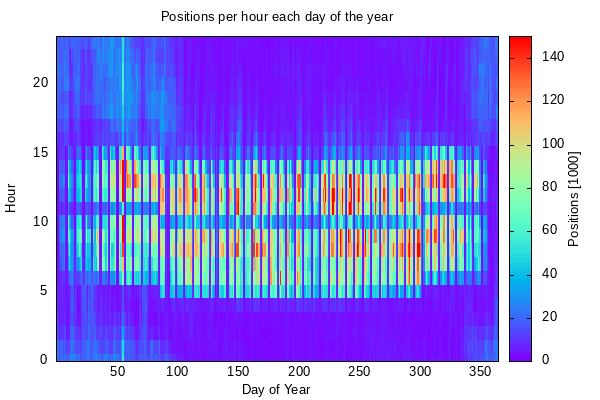
|
|
|
Mountpoints - Summary all yearSuccess story of MSM: MSM only 25% in 2019. MSM and VRS was equally used 2020, factor of 2.25 of MSM w.r.t VRS in 2021. V03LN02 - switch off in February 2021. 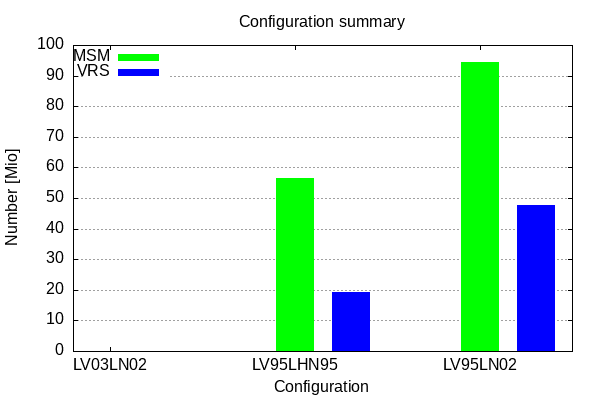
|
|
|
Mountpoints - Summary MonthSuccess story of MSM: increased MSM (GNSS) usage compared to VRS (GPS/GLO) since mid 2020. V03LN02 - switch off in February 2021. 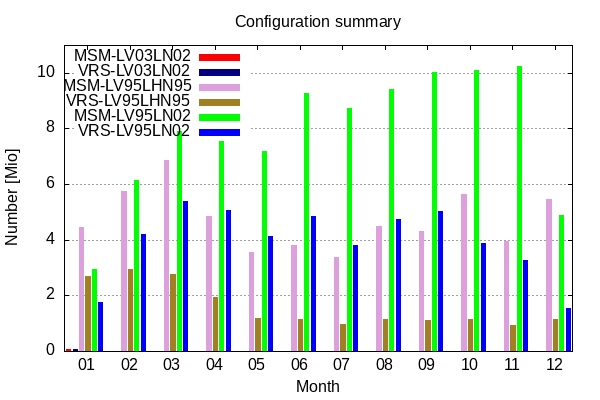
|
|
|
Reference Stations (all year)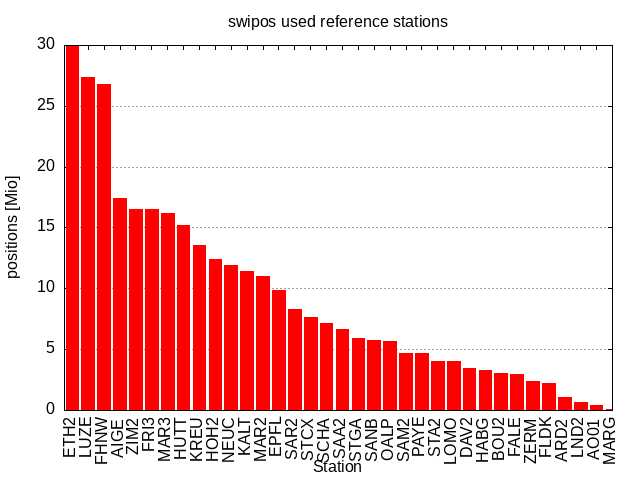
|
|
|
Used Rover Solution Type (all year)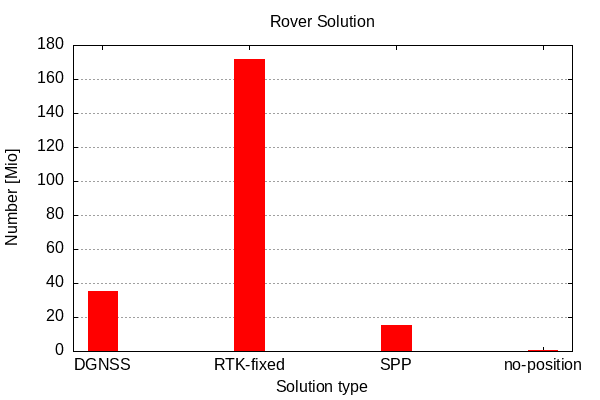
|
|
|